| “RESOLVED, that the compensation paid to the company’s named executive officers, as disclosed pursuant to Item 402 of Regulation S-K, including the Compensation Discussion and Analysis, compensation tables and narrative discussion, is hereby APPROVED.”
| | | | | | MDU Resources Group, Inc. Proxy Statement | 11 |
As this is an advisory vote, the results will not be binding on the company, the board of directors, or the compensation committee and will not require us to take any action. The final decision on the compensation of our named executive officers remains with our compensation committee and our board of directors, although our board and compensation committee will consider the outcome of this vote when making future compensation decisions. As the board of directors determined at its meeting in May 2011, we will provide our stockholders with the opportunity to vote on our named executive officer compensation at every annual meeting until the next required vote on the frequency of stockholder votes on named executive officer compensation. The next required vote on frequency will occur at the 2017 annual meeting of stockholders. The board of directors recommends a vote “for” the approval, on ana non-binding advisory basis, of
the compensation of our named executive officers, as disclosed in this proxy statement. Approval of the compensation of our named executive officers requires the affirmative vote of a majority of our common stock present in person or represented by proxy at the meeting and entitled to vote on the proposal. Abstentions will count as votes against this proposal. Broker non-votes are not counted as voting power present and, therefore, are not counted in the vote. | | | | | | MDU Resources Group, Inc. Proxy Statement
| 11
|
EXECUTIVE COMPENSATION Compensation Discussion and Analysis The following compensation discussion and analysis may contain statements regarding corporate performance targets and goals. These targets and goals are disclosed in the limited context of our compensation programs and should not be understood to be statements of management’s expectations or estimates of results or other guidance. We specifically caution investors not to apply these statements to other contexts. 2011 Named Executive Officers
For 2011, our named executive officers were Terry D. Hildestad, Doran N. Schwartz, J. Kent Wells, John G. Harp, and William E. Schneider. Mr. Hildestad is our president and chief executive officer, and Mr. Schwartz is our vice president and chief financial officer. Mr. Wells, president and chief executive officer of Fidelity Exploration & Production Company, a direct wholly-owned subsidiary of WBI Holdings, Inc., was hired in May 2011 and is a named executive officer for the first time. Mr. Harp was president and chief executive officer of MDU Construction Services Group, Inc. during 2011 and, effective January 1, 2012, became chief executive officer of Knife River Corporation as well as MDU Construction Services Group, Inc. Mr. Schneider was president and chief executive officer of Knife River Corporation during 2011 and, effective January 1, 2012, became MDU Resources Group, Inc. executive vice president of Bakken development.
Summary of Company Performance and Named Executive Officer Compensation Paid –2011– 2012 Compared to 2010 MDU Resources Group, Inc. was comprised of the following business segments in 2011:
2011
Our named executive officers for 2012 were: | | • | Terry D. Hildestad, our president and chief executive officer, who retired January 3, 2013 | | | • | Doran N. Schwartz, our vice president and chief financial officer | | | • | William E. Schneider, our executive vice president of Bakken development, a role he assumed on January 1, 2012 | | | • | J. Kent Wells, who led our exploration and production segment as president and chief executive officer of Fidelity Exploration & Production Company, a direct wholly-owned subsidiary of WBI Holdings, Inc., and | | | • | Steven L. Bietz, who led our pipeline and energy services segment as president and chief executive officer of WBI Holdings, Inc., which is the parent company of WBI Energy, Inc. and WBI Energy Services, Inc. | | | In addition to the business segments above, we have the following business segments: | | • | electric and natural gas distribution1under the leadership of David L. Goodin, who was during 2012 the president and chief executive officer of Montana-Dakota Utilities Co., Great Plains Natural Gas Co., Cascade Natural Gas Corporation, and Intermountain Gas Company, | | | •
| pipeline and energy services under the leadership of Steven L. Bietz, thewho was promoted, effective January 4, 2013, to be president and chief executive officer of WBI Holdings,MDU Resources Group, Inc., which is the parent company of WBI Pipeline & Storage Group, Inc. and WBI Energy Services, Inc.
| | | •
| exploration and production under the leadership of J. Kent Wells, the president and chief executive officer of Fidelity Exploration & Production Company, a subsidiary of WBI Holdings, Inc.
| | | •
| construction materials and contracting under the leadership of William E. Schneider, the president and chief executive officer of Knife River Corporation and
| | | • | construction services segment and construction materials and contracting segment under the leadership of John G. Harp, who is the president and chief executive officer of MDU Construction Services Group, Inc. and Knife River Corporation. |
Our consolidated financial results for 2011 and 2010 were:
| | | | | | | | Item | | 2011 Result | | 2010 Result | | Consolidated Earnings on Common Stock | | | $212.3 million | | | $240.0 million | | Earnings per Share (diluted) | | | $1.12 | | | $1.27 | | Return on Invested Capital | | | 6.3% | | | 7.0% | | Total Stockholder Return | | | 9.1% | | | (11.3)% | |
Our business segment results were as follows:
| | | •
| electric and natural gas distribution earnings increased from $65.9 million in 2010 to $67.7 million in 2011
| | | | •
| pipeline and energy services earnings decreased from $23.2 million in 2010 to $23.1 million in 2011
| | | | •
| exploration and production earnings decreased from $85.6 million in 2010 to $80.3 million in 2011
| | | | •
| construction materials and contracting earnings decreased from $29.6 million in 2010 to $26.4 million in 2011 and
| | | | •
| construction services earnings increased from $18.0 million in 2010 to $21.6 million in 2011.
| | | | | | 1 | Natural gas distribution is a separate business segment, although we are showing it combined in this discussion. |
| | | | | | 12 | MDU Resources Group, Inc. Proxy Statement |
WhileFinancial Results for 2012 and 2011 performance in our electric
Our consolidated financial results for 2012 was a loss of $1.4 million compared to 2011 earnings of $212.3 million. Adjusted earnings were $216.8 million for 2012, compared to 2011 adjusted earnings of $225.2 million. The following table compares 2012 results to 2011 results on a business segment basis. Adjusted earnings and natural gas and construction services segments was strong, performanceinformation in the pipelinetable below contain non-GAAP numbers. Please refer to the Use of Non-GAAP Financial Measures and energy services, explorationReconciliation of GAAP to Adjusted Earnings sections below.
| | | | | | | | Business Segment | | 2012 Earnings
($) (millions) | | 2011 Earnings
($) (millions) | | Electric and Natural Gas Distribution | | | 60.0 | | | 67.6 | | Pipeline and Energy Services | | | 11.6 | | | 23.1 | | Exploration and Production | | | 69.6 | | | 80.3 | | Construction Materials and Services | | | 70.8 | | | 48.0 | | Other | | | 4.8 | | | 6.2 | | | | | | | | | | Earnings Before Discontinued Operations, Noncash Write-Downs of Oil and Natural Gas Properties, and Net Benefit Related to Natural Gas Gathering Operations Litigation | | | 216.8 | | | 225.2 | | | | | | | | | | Income (Loss) from Discontinued Operations, Net of Tax* | | | 13.6 | | | (12.9 | ) | Effects of Noncash Write-Downs of Oil and Natural Gas Properties | | | (246.8 | ) | | — | | Net Benefit Related to Natural Gas Gathering Operations Litigation | | | 15.0 | | | — | | Earnings (Loss) on Common Stock | | | (1.4 | ) | | 212.3 | |
| | * | Reflects a 2012 reversal of a 2011 arbitration charge of $13.0 million after tax related to a guarantee of a construction contract |
Use of Non-GAAP Financial Measures
As noted above, the company, in addition to presenting its earnings information in conformity with Generally Accepted Accounting Principles (GAAP), has provided non-GAAP earnings data that reflects an adjustment to exclude a fourth quarter 2012 $145.9 million after-tax noncash ceiling test write-down, a third quarter 2012 $100.9 million after-tax noncash ceiling test write-down, as well as an adjustment to exclude a second quarter 2012 reversal of an arbitration charge of $15.0 million after-tax. The company believes that these non-GAAP financial measures are useful to investors because the items excluded are not indicative of the company’s continuing operating results. Also, the company’s management uses these non-GAAP financial measures as indicators for planning and production,forecasting future periods. The presentation of this additional information is not meant to be considered a substitute for financial measures prepared in accordance with GAAP. Reconciliation of GAAP to Adjusted Earnings | | | | | | | | | | | | | | | | 2012
Earnings
($) (millions) | | 2011
Earnings
($) (millions) | | 2012
Earnings
Per Share | | 2011
Earnings
Per Share | | Earnings (Loss) on Common Stock | | | (1.4 | ) | | 212.3 | | | (0.01 | ) | | 1.12 | | Discontinued Operations | | | (13.6 | ) | | 12.9 | | | (0.07 | ) | | 0.07 | | Noncash Write-Downs of Oil and Natural Gas Properties | | | 246.8 | | | — | | | 1.31 | | | — | | Net Benefit Related to Natural Gas Gathering Operations Litigation | | | (15.0 | ) | | — | | | (0.08 | ) | | — | | Adjusted Earnings | | | 216.8 | | | 225.2 | | | 1.15 | | | 1.19 | |
Total Realized Pay in 2012 and construction materials segments2011
The compensation committee believes considering total realized pay is equally as important as considering total compensation as presented in the summary compensation table. Total compensation as presented in the summary compensation table contains estimated values of grants of performance shares based on multiple assumptions that may or may not come to fruition. Also, the summary compensation table shows an increase in change in pension value and above-market earnings on nonqualified deferred compensation. The pension plan was frozen as of December 31, 2009, and none of the named executives’ benefit levels in the Supplemental Income Security Plan, our non-qualified retirement program, increased for 2012. The primary reason for increases in the change in pension value is due to a lower than in 2010. We believe thatdiscount rate used to calculate the values. Total realized pay, on the other hand, reflects the compensation actually earned, including the value of incentive awards if the goals are met and excluding the value of incentive awards if the goals are not met. Because we have not met certain performance measures in the last several years, our named executive officers for 2011 reflects these results. In termsofficers’ total realized pay excludes the value of remuneration, this overview focuses on theincentive awards that were not earned. We define total compensation paid to our named executives. Total compensation paid isrealized pay as the sum of base salary, annual incentive award paid, and the value realized upon the vesting of long-term incentive awards of performance shares, and restricted stock. While the compensation committee believes that totalall other compensation as reported in the Summary Compensation Table is important, it does not show the actual value in thesummary compensation paid to our named executive officers, which the compensation committee believes is important to show stockholders. The three major differences are that the total compensation reported in the Summary Compensation Table shows:table.
| | •
| the change in pension value, which increased in 2011 due to lower discount rates used to calculate the values. Because the defined benefit pension plans were frozen as of January 1, 2010, and none of our named executives received benefit level increases in our Supplemental Income Security Plan for 2011, their retirement benefits under these programs did not increase.
| | | •MDU Resources Group, Inc.Proxy Statement
| a grant date fair value assigned to performance share awards, which are potential payments based on multiple assumptions. Performance shares are paid, if at all, three years after grant, based upon our total stockholder return in comparison to our peer group and13
|
| | •Proxy Statement
| all other compensation for the named executives officers, which we excluded from total compensation paid because the dollar amount did not change from 2010 to 2011, except for a very small amount for Mr. Harp.
|
The following table compares total compensation paidrealized pay for our named executives in 2012 to Messrs. Hildestad, Schwartz, Harp, and Schneider, the four 2011 named executive officers who were also employed by the company in 2010. Three of the four named executive officer’s total compensation paid decreased in 2011 and, as a group, their total compensation paid decreased $821,353, or 17.3% when compared to 2010.2011. Total Compensation Paid in 2011 and 2010
| | | | | | | | | | | | | | | | | | | | | | | | | | | | | | | | | | | | | | | Named
Executive
Officer | | Year | | Base Salary
($) | | Annual
Incentive
Awards
Paid
($) | | Value
Realized
upon
Vesting of
Performance
Shares
($) | | Value
Realized
upon
Vesting of
Restricted
Stock
($)(3) | | Total
Compensation
Paid
($)(4) | | | Year | | Base Salary
($) | | Annual
Incentive
Awards
and
Bonus
Paid
($) | | Value
Realized
upon
Vesting of
Performance
Shares
($) | | All
Other
Compensation
($) | | Total
Realized
Pay
($) | | Terry D. Hildestad | | 2011 | | 750,000 | | 954,750 | | 0 | (1) | | — | | 1,704,750 | | | 2012 | | 750,000 | | 518,250 | | 0(1) | | | 38,224 | | 1,306,474 | | | | 2010 | | 750,000 | | 762,750 | | 720,474 | (2) | | 73,498 | | 2,306,722 | | | 2011 | | 750,000 | | 954,750 | | 0(2) | | | 37,499 | | 1,742,249 | | Doran N. Schwartz | | 2011 | | 273,000 | | 173,765 | | 0 | (1) | | — | | 446,765 | | | 2012 | | 300,000 | | 103,650 | | 0(1) | | | 34,224 | | 437,874 | | | �� | | 2010 | | 252,454 | | 127,053 | | 75,398 | (2) | | — | | 454,905 | | | 2011 | | 273,000 | | 173,765 | | 0(2) | | | 33,549 | | 480,314 | | John G. Harp | | 2011 | | 450,000 | | 438,750 | | 0 | (1) | | — | | 888,750 | | | Steven L. Bietz | | | 2012 | | 360,500 | | 347,973 | | 0(1) | | | 37,884 | | 746,357 | | | | | 2011 | | 360,500 | | 229,198 | | 0(2) | | | 37,159 | | 626,857 | | J. Kent Wells | | | 2012 | | 550,000 | | 934,042 | (3) | | N/A | | | 96,470 | | 1,580,512 | | | | 2010 | | 450,000 | | 438,750 | | 221,666 | (2) | | — | | 1,110,416 | | | 2011 | | 367,671 | | 1,923,991 | (4) | | N/A | | | 84,580 | | 2,376,242 | | William E. Schneider | | 2011 | | 447,400 | | 436,215 | | 0 | (1) | | — | | 883,615 | | | 2012 | | 447,400 | | 200,950 | | 0(1) | | | 38,224 | | 686,574 | | | | 2010 | | 447,400 | | 37,805 | | 329,179 | (2) | | 58,806 | | 873,190 | | | 2011 | | 447,400 | | 436,215 | | 0(2) | | 37,499 | | 921,114 | | | | | | | 2011 Total | | 3,923,880 | | | | | | | | 2010 Total | | 4,745,233 | | |
| | (1) | Performance shares and dividend equivalents granted for the 2009-2011 performance period that did not vest and were forfeited because performance was below threshold. | (2) | Performance shares and dividend equivalents granted for the 2008-2010 performance period that did not vest and were forfeited because performance was below threshold. | (2)(3)
| PerformanceReflects the value of the portion of Mr. Wells’ additional 2011 annual incentive award that was paid in shares paid for the 2007-2009 performance period. The value realized isof our common stock based on our closing stock price of $19.99 on February 11, 2010, and includes the dividend equivalents paid$21.67 on the vested shares.
| (3)
| Reflects the value of restricted shares granted in 2001 that vested automatically and were paid onvesting date, February 15, 2010, based on our closing stock price of $19.80 on February 12, 2010, as February 15, 2010, was a holiday.16, 2012.
| (4) | Total compensation paid is the sumMr. Wells was hired as president and chief executive officer of base salary,Fidelity Exploration & Production Company effective May 2, 2011. Includes a cash recruitment payment of $550,000, annual incentive award paid,payment of $448,981, and the value realized upon vestingadditional annual incentive payment of long-term incentive awards of performance shares and restricted stock.$925,010.
|
TheOur named executive officers forfeited all performance shares and dividend equivalents for the 2009-2011 performance period because our total stockholder return in comparison to our peer group was at the 25th percentile. With respect to the annual incentive awards, our 2012 results in the construction services segment, construction materials and contracting segment, and the pipeline and energy services segment were above their performance targets, and, conversely, 2012 results for the exploration and production segment and the electric and gas distribution segments were below their threshold performance goals, with 2012 consolidated earnings per share results also below threshold. Since the corporate named executives’ annual incentives depend on achievement of the foregoing performance goals, Messrs. Hildestad’s, Schwartz’s, and Schneider’s 2012 annual incentives were paid below the target amount.
With respect to our chief executive officer, the following table further demonstrates our pay for performance policy specifically for our chief executive officerapproach by comparing: | | | • | his total compensation paid,realized pay, which is the sum of base salary, annual incentive awards paid, all other compensation, and the value realized upon the | | | | | o | vesting of restricted stock during 2010 | | | | | o | vesting of performance shares during 2007, 2008, 2009, and 2010 (none vested in 2011) and | | | | | o
| exercise of stock options in 20072011 or 2012)
| | | | • | his total compensation as reported in the summary compensation table and | | | | • | one-year total stockholder returns for 2007 to 2011.2008 through 2012. |
| | | | 14 | MDU Resources Group, Inc.Proxy Statement | 13
|
5 Year CEO Compensation and Total Stockholder Return 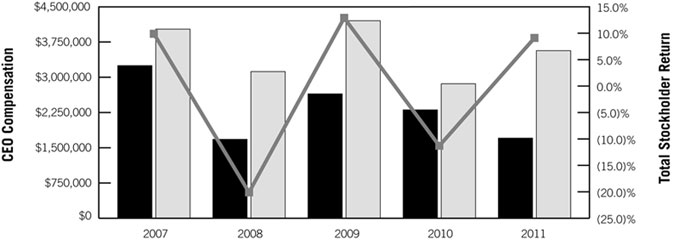 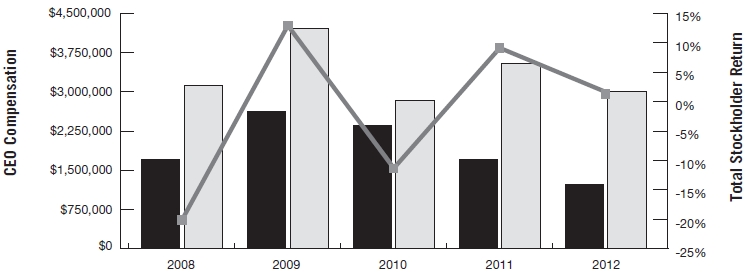
| | | | | | | | | | | | | | | | | | | | | 2007 | | 2008 | | 2009 | | 2010 | | 2011 | | 
| Total Compensation Paid | | | $3,248,707 | | | $1,680,323 | | | $2,647,426 | | | $2,306,722 | | | $1,704,750 | | 
| Total Compensation
from Summary
Compensation Table | | | $4,023,732 | | | $3,119,702 | | | $4,203,004 | | | $2,860,918 | | | $3,566,327 | | 
| 1 Year TSR | | | 9.9% | | | (20.1)% | | | 12.9% | | | (11.3)% | | | 9.1% | | | | | | | | | | | | | | | | | | | | Total Compensation Paid = Base Salary + Annual Bonus Paid + Performance Shares that Vested + Restricted Stock that Vested + 2007 Stock Option Exercise |
| | | | | | | | | | | | | | | | | | | | | 2008 | | 2009 | | 2010 | | 2011 | | 2012 | | 
| Total Realized Pay | | | $1,689,799 | | | $2,657,250 | | | $2,344,221 | | | $1,742,249 | | | $1,306,474 | | 
| Total Compensation
from Summary
Compensation Table | | | $3,119,702 | | | $4,203,004 | | | $2,860,918 | | | $3,566,327 | | | $2,558,778 | | 
| 1 Year Total
Stockholder Return | | | -20.1% | | | 12.9% | | | -11.3% | | | 9.1% | | | 2.1% | |
Comparing Mr. Hildestad’sThe yearly changes in total compensation paid and total compensation as reported infrom the summary compensation table against annualand total realized pay align very closely with the yearly changes in total stockholder return shows:return.
Overview of 2012 Compensation for our Named Executive Officers
In 2012, we continued our approach of referencing market data to establish competitive pay levels for base salary, total annual cash, which is base salary plus target annual incentive, and total direct compensation, which is the sum of total annual cash plus the expected value of target long-term incentives. We discuss this competitive assessment in the Role of Management section below. To ensure compensation awarded to named executive officers was commensurate with competitive performance levels, we continued to compare: | | • | In 2007, annual total stockholder return was 9.9%results to the results of our performance graph peer group to determine payouts under our performance share program and Mr. Hildestad’s total compensation paid increased by 65% and his total compensation as reported in the summary compensation table increased by 30%.
| | | • | In 2008, annual total stockholderon a historical basis, our targeted and actual results on return was (20.1)% and Mr. Hildestad’s total compensation paid decreased by 48% and his total compensation as reported inon invested capital to the summary compensation table decreased by 23%.
| | | •
| In 2009, annual total stockholder return was 12.9% and Mr. Hildestad’s total compensation paid increased by 58% and his total compensation as reported in the summary compensation table increased by 35%.
| | | •
| In 2010, annual total stockholder return was (11.3)% and Mr. Hildestad’s total compensation paid decreased by 13% and his total compensation as reported in the summary compensation table decreased by 32%.
| | | •
| In 2011, annual total stockholder return was 9.1% and Mr. Hildestad’s total compensation paid decreased by 26% and his total compensation as reported in the summary compensation table increased by 25%.
|
| Overview of 2011 Compensation for our Named Executive Officers
| Our 2011 compensation program for our named executive officers was designed to link their compensation to our financial performance and align their interests with thoseresults of our stockholders. Mr. Wells’performance graph peer group when the compensation wascommittee established to induce him to join the company while, at the same time, basing his incentive payments on the attainment of financial results. We discuss Mr. Wells’ compensation in a separate section below, and the following discussionperformance targets for annual incentives of our named executive officers’ compensation excludes Mr. Wells.business segment leaders.
| | Our overall compensation program and philosophy is built on a foundation of these guiding principles: |
| | • | we pay for performance, with 55.6% to 71.4%76.5% of our named executive officers’ 20112012 total target direct compensation in the form of incentives | | | • | we determine annual performance incentives based on financial criteria that are important to stockholder value, –including earnings per share and return on invested capital and | | | • | we determine long-term performance incentives based on total stockholder return relative to our peersperformance graph peer group | | | • | we review competitive compensation data for eachour named executive officerofficers, to the extent available, and incorporate internal equity in the final determination of target compensation levels and | | | • | through our PEER Analysis, we compare our pay-for-performance results with the pay-for-performance results ofon key financial metrics – revenue, profit, return on invested capital, and stockholder return – in comparison to our peers over five-year periods.performance graph peer group. |
| | | | 14
| MDU Resources Group, Inc.Proxy Statement
|
The compensation committee took the following actions with respect to 2011 compensation for our named executive officers:
| | •
| froze 2011 base salaries at their 2009 and 2010 levelsThe compensation committee took the following actions with respect to 2012 compensation for Messrs. Hildestad, Harp, and Schneider and provided a 5% salary increase only to Mr. Schwartzour named executive officers:
| | | • | maintainedgranted a salary increase to Mr. Hildestad to recognize his effective leadership during an extended period of economic softness. Mr. Hildestad subsequently rejected the same percentagessalary increase because he felt accepting the increase would be out of place since five of the thirteen Section 16 officers did not receive an increase for 2012
| | | • | granted a salary increase to Mr. Schwartz to bring his salary closer to his salary grade midpoint |
| | | | MDU Resources Group, Inc. Proxy Statement | 15 |
| | • | tied 25% of our business segment leaders’ 2012 annual incentive targets to the company’s 2012 earnings per share results in order to more closely align amounts paid to these executives with total company results | | | • | increased Mr. Wells’ annual incentive target from 100% to 125% of base salary used to establish target incentive awardsmitigate the impact of the added company earnings per share goal and to reflect his impact on overall company results | | | • | continued to link our corporate executives’ – i.e., Messrs. Hildestad, Schwartz, and SchwartzSchneider – 20112012 annual incentive awards to the achievement of our business units’segments’ performance goals | | | • | maintained the limitation on the maximum payment with respect to the return on invested capital portion of the 2011 annual incentive awards at MDU Construction Services Group, Inc., Knife River Corporation, Fidelity Exploration & Production Company, and WBI Holdings, Inc. at 100% of the target incentive award, unless return on invested capital equaled or exceeded the business unit’s weighted average cost of capital
| | | •
| provided for mandatory reductions in any performance shares earned pursuant to awards granted in 2011 if our total stockholder return for the 2011-2013 performance period is negative
| | | •
| in 2011 the compensation committee did not approve payment of any performance shares or dividend equivalents granted in 20082009 for the 2008-20102009-2011 performance period due to our negative total stockholder return for the 2008-20102009-2011 performance period placing us in the 33rd25th percentile compared to our performance graph peer group
| | | •
| imposed mandatory stock holding requirements on a portion of shares earned pursuant to long-term incentive awards granted in 2011 or thereafter and
| | | • | granted no increases under our SISP,Supplemental Income Security Plan, which is a nonqualified retirement plan that provides benefits to our key managers and four of our named executive officers. |
| J. Kent Wells
| We hired Mr. Wells as the president and chief executive officer of Fidelity Exploration & Production Company, effective May 2, 2011. Mr. Hildestad, with assistance from our vice president-human resources, negotiated Mr. Wells’ compensation in connection with his hiring; his compensation is set forth in a letter agreement, which was approved by the compensation committee and the board of directors at their regular February 2011 meetings. The compensation committee approved Mr. Wells’ compensation after considering his extensive experience in leading the oil and gas industry and his demonstrated track record of substantially increasing reserves and production while reducing finding costs.
| | Mr. Wells’ letter agreement provides for the following:
|
| | | •
| a base salary of $550,000, prorated for his eight months of employment during 2011. We discuss how Mr. Wells’ base salary was determined in the Base Salaries of the Named Executive Officers for 2011 section below.
| | | | •
| a cash recruitment payment of $550,000 to induce Mr. Wells to join the company and to offset the forfeiture of restricted stock granted by his former employer that would otherwise have vested in 2012 and 2013
| | | | •
| a target annual incentive award opportunity of 100% of base salary prorated to reflect his eight months of employment during 2011. Mr. Wells would receive a guaranteed minimum payment equal to the 2011 prorated target amount and could earn up to 200% of target if:
| | | | | o
| Fidelity Exploration & Production Company and WBI Holdings, Inc.’s 2011 earnings per share were at or above 115% of the performance targets approved by the compensation committee
| | | | | o
| Fidelity Exploration & Production Company and WBI Holdings, Inc.’s 2011 returns on invested capital were both at least equal to their respective weighted average costs of capital
| | | | | o
| Fidelity Exploration & Production Company achieved its production goal and
| | | | | o
| WBI Holdings, Inc. achieved its five safety goals.
| | | | | We discuss this incentive award in the 2011 Annual Incentives section below.
| | | | •
| to offset other compensation Mr. Wells would have received if he had stayed with his former employer, an additional 2011 incentive award opportunity to earn $1.85 million, payable one-half in cash and one-half in our common stock, if Fidelity Exploration & Production Company’s 2011 cash flow from operations exceeded $132.0 million. We discuss this incentive award in the 2011 Annual Incentives section below.
| | | | •
| commencing in 2012, a target long-term incentive opportunity of 200% of base salary and
| | | | •
| relocation benefits consisting of:
| | | | | o
| reasonable expenses for two home finding trips for Mr. Wells and his spouse
| | | | | o
| monthly reimbursements of up to $3,000 for 6 months for temporary living expenses
|
| | | | MDU Resources Group, Inc.Proxy Statement
| 15
|
| | | | | o
| reasonable expenses incurred during the actual move from the Houston area to Denver
| | | | | | o
| reimbursementIn addition, our Section 16 officers who had change of actual and reasonable costs of moving household goods and personal effects
| | | | | | o
| a relocation allowance equal to one month’s salary
| | | | | | o
| reimbursement of the following home sale expenses:
| | | | | | | •
| reasonable attorney’s fees
| | | | | | | •
| federal, state and local transfer taxes
| | | | | | | •
| search fees and title insurance
| | | | | | | •
| brokerage commission of a licensed real estate broker
| | | | | | | •
| mortgage prepayment penalties
| | | | | | | •
| recording fees
| | | | | | | •
| any other fees or expenses approved in advance in writing by the company
| | | | | | o
| a bonus of 3% of the sales price of Mr. Wells’ Houston area home up to a maximum of $15,000
| | | | | | o
| reimbursement of the following costs to acquire a new home if Mr. Wells purchases a new home within 18 months from his hire date:
| | | | | | | •
| title search and title insurance
| | | | | | | •
| mortgage service charges and mortgage taxes
| | | | | | | •
| bank applications and processing and appraisal fees
| | | | | | | •
| recording and notary fees
| | | | | | | •
| state and local transfer taxes
| | | | | | | •
| termite inspection
| | | | | | | •
| land survey
| | | | | | | •
| attorney’s fees up to a maximum of 1% of the new mortgage amount
| | | | | | | •
| origination fees or points up to a maximum of 2% of the new mortgage amount and
| | | | | | | •
| any other fees or expenses approved in writing by the company and
| | | | | | o
| spousal career assistance.
| | | | | Mr. Wells received $66,031 in relocation benefits for 2011 consisting of $18,000 in temporary living expenses, $2,198 in actual move and related expenses, and $45,833 in relocation allowance. We anticipate Mr. Wells completing his relocationcontrol employment agreements agreed to the Denver area duringearly termination of their agreements, effective November 1, 2012.
| | | | | Mr. Wells must repay the relocation benefits he received if he resigns from the company within one year from when his household goods and personal effects are moved to the Denver area.
| | | | | Objectives of our Compensation Program | We structure our compensation program to help retain and reward the executive officers who we believe are critical to our long-term success. We have a written executive compensation policy for our Section 16 officers, including all our named executive officers. Our policy has the followingpolicy’s stated objectives:objectives are to: | | | | | • | recruit, motivate, reward, and retain the high performing executive talent required to create superior long-term total stockholder return in comparison to our peer group | | | | | • | reward executives for short-term performance, as well as the growth in enterprise value over the long-term | | | | | • | provide a competitive package relative to industry-specific and general industry comparisons and internal equity, as appropriate | | | | | • | ensure effective utilization and development of talent by working in concert with other management processes – for example, performance appraisal, succession planning, and management development and | | | | | • | help ensure that compensation programs do not encourage or reward excessive or imprudent risk taking. |
| | | | 16
| MDU Resources Group, Inc.Proxy Statement
|
| Elements of our Compensation Program | We pay/grant: | | | • | base salaries in order to provide executive officers with sufficient, regularly-paid income and attract, recruit, and retain executives with the knowledge, skills, and abilities necessary to successfully execute their job duties and responsibilities | | | • | opportunities to earn annual incentive compensation in order to be competitive from a total remuneration standpoint and ensure focus on annual financial and operating results and | | | • | opportunities to earn long-term incentive compensation in order to be competitive from a total remuneration standpoint and ensure focus on stockholder return. | | | If earned, incentive compensation, which consists of annual cash incentive awards and three-year performance share awards under our Long-Term Performance-Based Incentive Plan, makes up the greatest portion of our named executive officers’ total compensation. The compensation committee believes incentive compensation that comprised approximately 55.6% to 71.4%76.5% of total target compensation for the named executive officers except for Mr. Wells, for 2011 is appropriate because: | | | • | our named executive officers are in positions to drive, and therefore bear high levels of responsibility for, our corporate performance | | | • | incentive compensation is more variable than base salary and dependent upon our performance | | | • | variable compensation helps ensure focus on the goals that are aligned with our overall strategy and | | | • | the interests of our named executive officers will be aligned with those of our stockholders by making a majority of the named executive officers’ target compensation contingent upon results that are beneficial to stockholders. |
| | | | | | 16 | MDU Resources Group, Inc. Proxy Statement |
The following table shows the allocation of total target compensation for 20112012 among the individual components of base salary, annual incentive, and long-term incentive: | | | | | | | | | | | | | | | | | | | | | | | | | | | | % of Total
Target
Compensation
Allocated to
Base Salary (%) | | % of Total Target Compensation
Allocated to Incentives | | | | | | | | | | | | | | | | | | Annual +
Long-Term (%) | | | | Name | | | % of Total
Target
Compensation
Allocated to
Base Salary (%) | | % of Total Target Compensation
Allocated to Incentives | | | | | | | % of Total
Target
Compensation
Allocated to
Base Salary (%) | | Annual (%) | | Long-Term (%) | | Annual +
Long-Term (%) | | Annual (%) | | Long-Term (%) | | Annual +
Long-Term(%) | | Terry D. Hildestad | | 28.6 | | 42.8 | | | 28.6 | | 28.6 | | 42.8 | | 71.4 | | Doran N. Schwartz | | 22.2 | | 33.4 | | 55.6 | | | 44.4 | | 22.2 | | 33.4 | | 55.6 | | | Steven L. Bietz | | | 39.2 | | 25.5 | | 35.3 | | 60.8 | | J. Kent Wells (1) | | 81.4 | | 0.0 | | 81.4 | | | 23.5 | | 29.4 | | 47.1 | | 76.5 | | John G. Harp | | 39.2 | | 25.5 | | 35.3 | | 60.8 | | | William E. Schneider | | 39.2 | | 25.5 | | 35.3 | | 60.8 | | | 39.2 | | 25.5 | | 35.3 | | 60.8 | | (1) Mr. Wells received two annual incentive awards in 2011, but no long-term incentive award in 2011. | | |
In order to reward long-term growth, as well as short-term results, the compensation committee establishes incentive targets that emphasize long-term compensation as much as or more than short-term compensation for our named executive officers. Except for Mr. Wells, the annual incentive targets for 2011 range from 50% to 100% of base salary and the long-term incentive targets range from 75% to 150% of base salary, depending on the named executive officer’s salary grade. In Mr. Wells’ case for 2011, his incentives are made up of a target annual incentive opportunity of 100% of base salary plus an additional incentive opportunity of $1.85 million. After 2011 and pursuant to his letter agreement, Mr. Wells’ target annual incentive opportunity will remain at 100% of base salary and his long-term incentive target will be 200% of base salary. Generally, our approach is to allocategenerally allocates a higher percentage of total target compensation to the long-term incentive than to the short-term incentive for our higher level executives, since they are in a better position to influence our long-term performance. Additionally, the long-term incentive, if earned, is paid in company common stock. These awards, combined with our stock retention requirements and stock ownership policy, promote ownership of our stock by the named executive officers. The compensation committee believes that, as stockholders, the named executive officers will be motivated to consistently deliver financial results that build wealth for all stockholders over the long-term. | Role of Compensation ConsultantsManagement | Our executive compensation policy providescalls for an assessment of the competitive pay levels for base salary and incentive compensation for each Section 16 officer position to be conducted at least every two years by an independent consulting firm. InTowers Watson conducted the study in 2010 for purposes of 2011 compensation,use by the compensation committee retained Towers Watson, a nationally recognized consulting firm, to perform this assessment and to assistdetermine 2011 compensation levels. In 2011, the compensation committee requested the competitive assessment be completed internally. They directed the vice president-human resources and the human resources department to prepare the competitive assessment in August 2011 on Section 16 officers for their use in establishing competitive compensation targets for our Section 16 officers. |
| | | | MDU Resources Group, Inc.Proxy Statement
| 17
|
| Proxy Statement
| 2012 compensation. |
The assessment included identifying any material changes to the positions analyzed, and their scopes of responsibility, summarizing current incumbent compensation information, updating competitive compensation information, gathering and analyzing relevant general and industry-specific survey data, validating position matches and survey data with our management, assessing pay relationships for our chief executive officer as compared to our chief financial officer and the business unit presidents and chief executive officers, and updating the base salary structure. Towers WatsonThe human resources department assessed competitive pay levels for base salary, total annual cash, which is base salary plus target annual incentives, and total direct compensation, which is the sum of total annual cash and the expected value of target long-term incentives. TheyThe competitive assessment compared our positions to like positions contained in general industry compensation surveys and industry-specific compensation surveys and, for our chief executive officer, tosurveys. The human resources department aged the chief executive officers in our performance graph peer group. Towers Watson also aged thesurvey data from the date of the surveyssurvey by 2.5% on an annualized basis to estimate 2011the 2012 competitive targets. The compensation surveys and databases used by Towers Watson were:are listed on the following table: | | | | | | | | | | Survey* | | Number of
Companies
Participating
(#) | | Median
Number of
Employees
(#)(1) | | Publicly-
Traded
Companies
(#) | | Number of
Median
Revenue
(000s)
($) | | Towers Perrin 2009 Compensation Databank General Industry Executive Database | | 428 | | 19,083 | | 310 | | 6,199,000 | | Towers Perrin 2009 Compensation Databank Energy Services Executive Database | | 98 | | 3,290 | | 62 | | 3,371,000 | | 2009 Effective Compensation, Inc. Oil & Gas Exploration Compensation Survey | | 119 | | 451 | | 49 | | Not reported | | Mercer’s 2009 Total Compensation Survey for the Energy Sector | | 276 | | Not reported | | 205 | | 1,057,000 | | Watson Wyatt 2009/2010 Report on Top Management Compensation | | 2,275 | | — | (2) | — | (2) | — | (2) |
| | | | | | | | | | | | | | Survey* | | Number of
Companies
Participating
(#) | | Median
Number of
Employees
(#)(1) | | Number of
Publicly-
Traded
Companies
(#) | | Median
Revenue
(000s)
($) | | Towers Watson 2010 General Industry Executive Database | | | 430 | | | 16,400 | | | 312 | | | 5,112,000 | | Towers Watson 2010 U.S. CDB Energy Services Executive Database | | | 102 | | | 3,012 | | | 67 | | | 2,818,000 | | 2010 Effective Compensation, Inc. Oil & Gas Exploration Compensation Survey | | | 121 | | | 439 | | | 48 | | | Not Reported | | Mercer’s 2010 Total Compensation Survey for the Energy Sector | | | 297 | | | Not Reported | | | 201 | | | 823,000 | | Towers Watson 2010/2011 Report on Top Management Compensation | | | 3,422 | | | — | (2) | | — | (2) | | — | (2) |
| | | (1) | For the 20092010 Effective Compensation, Inc. Oil & Gas Exploration Compensation Survey, the number reported as the Median Number of Employees is the average number of employees. | (2) | The 2,2753,422 organizations participating in Watson Wyatt’s 2009/2010Towers Watson’s 2010/2011 Top Management Compensation Survey included 350394 organizations with 2,000 to 4,999 employees; 327308 organizations with 5,000 to 9,999 employees; 264205 organizations with 10,000 to 19,999 employees; and 33087 organizations with 20,000 or more employees. Towers Watson Wyatt did not provide a revenue breakdown or the number of publicly-traded companies participating in its survey. | * | The information in the table is based solely upon information provided by the publishers of the surveys and is not deemed filed or a part of this compensation discussion and analysis for certification purposes. For a list of companies that participated in the compensation surveys and databases, see Exhibit A. | | |
In billions of dollars our revenues for 2009, 2010, 2011, and 20112012 were approximately $4.2, $3.9, $4.0, and $4.0,$4.1, respectively. Since there were no specific data sources dedicated to the construction services or construction material industries, Towers Watson considered data from a subset of companies in the Towers Perrin 2009 Compensation Databank General Industry Executive Database and five public companies. The companies from the general industry survey, along with key financial data, were:
| | | | | | | | Company Name* | | Market Capitalization
Fiscal Year-End
($) (millions) | | Revenue
($) (millions) | | Total Assets
($) (millions) | | Hovnanian Enterprises | | 302.8 | | 1,596.3 | | 2,024.6 | | KB Home | | 1,193.4 | | 1,824.9 | | 3,436.0 | | Owens Corning | | 3,276.1 | | 4,803.0 | | 7,167.0 | | PulteGroup | | 3,822.7 | | 4,084.4 | | 10,051.2 | | Carpenter Technology | | 916.2 | | 1,362.3 | | 1,497.4 | | Century Aluminum | | 1,498.2 | | 899.3 | | 1,861.8 | | Crown Holdings | | 4,129.5 | | 7,938.0 | | 6,532.0 | | Kennametal | | 1,559.2 | | 1,999.9 | | 2,347.0 | | Martin Marietta Materials | | 4,052.6 | | 1,702.6 | | 3,239.3 | | Newmont Mining | | 23,338.6 | | 7,705.0 | | 22,299.0 | | Vulcan Materials | | 6,654.0 | | 2,690.5 | | 8,533.0 | |
| | *
| The information in the table is based solely upon information provided by the publisher of the general industry survey and is not deemed filed or a part of this compensation discussion and analysis for certification purposes.
|
| | | | | | 18
| MDU Resources Group, Inc. Proxy Statement
|
The five public companies Towers Watson referenced, along with key financial data, were:
| | | | | | | | | | | Company Name* | | Market Capitalization
Fiscal Year-End
($) (millions) | | Revenue
($) (millions) | | Total Assets
($) (millions) | | Dycom Industries | | | 496.5 | | | 1,106.9 | | | 693.5 | | Quanta Services | | | 4,363.8 | | | 3,318.1 | | | 4,117.0 | | EMCOR Group | | | 1,781.1 | | | 5,547.9 | | | 2,981.9 | | U.S. Concrete | | | 34.1 | | | 534.5 | | | 389.2 | | Granite Construction | | | 1,300.3 | | | 1,963.5 | | | 1,709.6 | |
| | | | *
| The information in the table is based solely upon information provided by Towers Watson and is not deemed filed or a part of this compensation discussion and analysis for certification purposes.
|
Revenues for 2009, 2010, and 2011 were approximately $819.0 million, $789.1 million and $854.0 million, respectively, for our construction services segment and were approximately $1.5 billion each year for our construction materials segment.
| Role of Management
| To verify the comparability of Mr. Hildestad’s target long-term incentive compensation and his Supplemental Income Security Plan benefits, the compensation committee directed the human resources department to prepare a report comparing the combined value of long-term incentive compensation and nonqualified defined benefit plan benefits of other chief executive officers. The report was prepared by compiling data from Equilar, Inc. and presented at the compensation committee’s November 2010 meeting. The report compared Mr. Hildestad’s target long-term incentive compensation and the Supplemental Income Security Plan benefits to those of the chief executive officers in our performance graph peer group as of February 2010 and companies with revenues ranging from $2.5 billion to $6.5 billion in the construction, energy, and utility industries. We discuss the results of this review in the 2011 Long-Term Incentives section below.
|
The following companies were in our performance graph peer group as presented at the November 2010 compensation committee meeting:
| | | | •
| Alliant Energy Corporation
| •
| OGE Energy Corp.
| •
| Berry Petroleum Company
| •
| ONEOK, Inc.
| •
| Black Hills Corporation
| •
| Quanta Services, Inc.
| •
| Comstock Resources, Inc.
| •
| Questar Corporation
| •
| Dycom Industries, Inc.
| •
| SCANA Corporation
| •
| EMCOR Group, Inc.
| •
| Southwest Gas Corporation
| •
| Encore Acquisition Company
| •
| St. Mary Land & Exploration Company
| •
| EQT Corporation
| •
| Swift Energy Company
| •
| Granite Construction Inc.
| •
| U.S. Concrete, Inc.
| •
| Martin Marietta Materials, Inc.
| •
| Vectren Corporation
| •
| National Fuel Gas Co.
| •
| Vulcan Materials Company
| •
| Northwest Natural Gas Company
| •
| Whiting Petroleum Corporation
| •
| NSTAR
| | |
The other companies reviewed for this assessment are listed in Exhibit B.
At the request of Mr. Hildestad, the human resources department conducted a competitive assessment in January 2011 to determine the compensation level necessary to recruit a qualified individual to lead Fidelity Exploration & Production Company. Mr. Hildestad, with the assistance of our vice president–human resources, negotiated Mr. Wells’ compensation in connection with his hiring. The January 2011 competitive assessment is discussed in the Base Salaries of the Named Executive Officers for 2011 section below.
The chief executive officer played an important role in recommending 2011 compensation to the committee for the other named executive officers. The chief executive officer assessed the performance of the named executive officers and reviewed the relative value of the named executive officers’ positions and their salary grade classifications. He then reviewed the competitive assessment prepared by Towers Watson and worked with the compensation consultants and the human resources department to prepare 2011 compensation recommendations for the compensation committee, other than for himself. The chief executive officer attended compensation committee meetings; however, he was not present during discussions regarding his compensation.
| | | | | | MDU Resources Group, Inc. Proxy Statement | 1917
|
The human resources department also augmented the competitive analysis by using Equilar to provide information on what was reported by companies in our performance graph peer group and by other public companies in relevant industries, as selected by the human resources department and as determined by SIC codes and as disclosed in their SEC filings. The companies referenced via Equilar and the positions for which they were used are found in Exhibit B. For our president and chief executive officer, the Equilar companies included all companies in our performance graph peer group and data on 68 additional chief executive officers from public companies in the energy, construction, and utility industries with revenues ranging from $1 billion to $8 billion. For our vice president and chief financial officer, the Equilar companies included all companies in our performance graph peer group and data on 55 additional chief financial officers from public companies in the energy, construction, and utility industries with revenues ranging from $1 billion to $8 billion. For the president and chief executive officer of our exploration and production segment, the Equilar companies included the exploration and production companies in our performance graph peer group and data on 27 additional chief executive officers from public companies in the oil and gas exploration and production industries with revenues ranging from $250 million to $850 million. For the president and chief executive officer of the pipeline and energy services segment, the Equilar companies included the pipeline and energy services companies in our performance graph peer group and data on 13 chief executive officers from public companies in the pipeline and energy services industry with revenues of $1 billion or less. The chief executive officer played an important role in recommending 2012 compensation to the committee for the other named executive officers. The chief executive officer assessed the performance of the named executive officers and considered the relative value of the named executive officers’ positions and their salary grade classifications. He then reviewed the competitive assessment prepared by the human resources department to formulate 2012 compensation recommendations for the compensation committee, other than for himself. The chief executive officer attended compensation committee meetings; however, he was not present during discussions regarding his compensation. | Timing of Compensation Decisions for 20112012 | The compensation committee, in conjunction with the board of directors, determined all compensation for each named executive officer for 20112012 and set overall and individual compensation targets for the three components of compensation – base salary, annual incentive, and long-term incentive. The compensation committee made recommendations to the board of directors regarding compensation of all Section 16 officers, and the board of directors then approved the recommendations. |
The compensation committee reviewed the competitive assessment and established 20112012 salary grades at its August 20102011 meeting. At the November 20102011 meeting, it established individual base salaries, target annual incentive award levels, and target long-term incentive award levels for 2011.2012. At their February 2011and March 2012 meetings, the compensation committee and the board of directors increased the target annual incentive award level for Mr. Wells and determined annual and long-term incentive awards, along with the payouts based on performance from the recently completed performance period for prior annual and long-term awards. The February 2011and March 2012 meetings occurred after the release of earnings for the prior year. Our stockholders had their first advisory vote on our named executive officers’ compensation at the 2011 Annual Meeting of Stockholders, and approximately 94% of the shares present in person or represented by proxy and entitled to vote on the matter approved the named executive officers’ compensation. The compensation committee and the board of directors considered the results of the vote at their November 2011 meetings and did not change our executive compensation program as a result of the vote.
| Salary Grades for 2011Stockholder Advisory Vote (“Say on Pay”)
| Our stockholders had their second advisory vote on our named executive officers’ compensation at the 2012 Annual Meeting of Stockholders. Approximately 92% of the shares present in person or represented by proxy and entitled to vote on the matter approved the named executive officers’ compensation. The 92% approval is consistent with the results of our say on pay vote at the 2011 Annual Meeting. The compensation committee and the board of directors considered the results of the votes at their November 2011 and November 2012 meetings and did not change our executive compensation program as a result of the votes. | | Salary Grades for 2012 | The compensation committee determines the named executive officers’ base salaries and annual and long-term incentive targets by reference to salary grades. Each salary grade has a minimum, midpoint, and maximum annual salary level with the midpoint targeted at approximately the 50th percentile of the competitive assessment data for positions in the salary grade. The compensation committee may adjust the salary grades away from the 50th percentile in order to balance the external market data with internal equity. The salary grades also have annual and long-term incentive target levels, which are expressed as a percentage of the individual’s actual base salary. We generally place named executive officers into a salary grade based on historical classification of their positions; however, the compensation committee reviews each classification and may place a position into a different salary grade if it determines that the targeted competitive compensation for the position changes significantly or the executive’s responsibilities and/or performance warrants a different salary grade. The committee also considers, upon recommendation from the chief executive officer, a position’s relative value. |
Our named executive officers’ salary grade classifications are listed below along with the 2011 base salary ranges associated with each classification:
| | | | | | | | | | | | | | | | | | 2011 Base Salary (000s) | | Position | | Grade | | Name | | Minimum
($) | | Midpoint
($) | | Maximum
($) | | President and CEO | | K | | Terry D. Hildestad | | 620 | | 775 | | 930 | | Vice President and CFO | | I | | Doran N. Schwartz | | 260 | | 325 | | 390 | | President and CEO, Fidelity Exploration & Production Company | | J | | J. Kent Wells | | 312 | | 390 | | 468 | | President and CEO, MDU Construction Services Group, Inc. | | J | | John G. Harp | | 312 | | 390 | | 468 | | President and CEO, Knife River Corporation | | J | | William E. Schneider | | 312 | | 390 | | 468 | |
The presidents and chief executive officers of MDU Construction Services Group, Inc. and Knife River Corporation were assigned to salary grade “J” and were unchanged for 2011. In connection with his hiring, the president and chief executive officer of Fidelity Exploration & Production Company was assigned to salary grade “J” in recognition of the importance of this business segment to the company and the elevation of this position to be a direct report to our president and chief executive officer. The committee believes that from an internal equity standpoint, these positions should carry the same salary grade. The vice president and CFO position remained in salary grade “I” for 2011 to maintain a one-step difference in salary grade level when compared to the president and chief executive officer positions at our business units and to reflect the separate treasurer position created in 2010. After reviewing the competitive analysis, the compensation committee made no changes in the base salary ranges associated with each named executive officer’s salary grade classification.
At its August 2010 meeting, the compensation committee reviewed Towers Watson’s assessment of internal equity between our chief executive officer, our chief financial officer, and the presidents and chief executive officers of our business units. The assessment showed that our chief executive officer’s 2010 pay as a multiple of the 2010 pay of our business units’ presidents and chief executive officers is generally consistent with the chief executive officer pay multiples of our performance graph peer group. Additionally, our chief executive officer’s 2010 pay as a multiple of our chief financial officer’s 2010 pay is higher than the chief executive officer pay multiple of our performance graph peer group due to our chief financial officer’s recent promotion to the position. The table below shows pay multiples for base salary, target annual cash, which is base salary plus target annual incentives, and total target direct compensation, which is the sum of target annual cash and the expected value of target long-term incentives.
| | | | | | 2018
| MDU Resources Group, Inc. Proxy Statement |
Internal Equity Assessment*compensation for the position changes significantly or the executive’s responsibilities and/or performance warrants a different salary grade. Individual executives may be paid below, equal to, or above the salary grade midpoint. Mr. Wells’ 2011 compensation was determined pursuant to his letter agreement in connection with his hiring effective May 2, 2011, and served as a basis for his 2012 compensation, rather than the business segment leaders’ salary grade.
| | | | | | | | | | | | | | | | | | | | 2010 CEO Pay Multiple for
MDU Resources Group, Inc.
| | CEO Pay Multiple of
Performance Graph Peer Group (1)
| | Title
| | Company or Business Unit
| | Base
Salary
| | Target
Annual
Cash
| | Total
Target Direct
Compensation
| | Base
Salary
| | Target
Annual
Cash
| | Total
Target Direct
Compensation
| | President & CEO
| | MDU Resources Group, Inc.
| | —
| | —
| | —
| | —
| | —
| | —
| | Vice President & CFO
| | MDU Resources Group, Inc.
| | 2.9x
| | 3.8x
| | 4.5x
| | 2.0x
| | 2.2x
| | 2.4x
| | President & CEO / 2nd Highest Paid
| | MDU Construction Services
| | | | | | | | | | | | | | | | Group, Inc.
| | 1.7x
| | 2.0x
| | 2.3x
| | 1.6x
| | 1.7x
| | 1.8x
| | President & CEO / 3rd Highest Paid
| | Knife River Corporation
| | 1.7x
| | 2.0x
| | 2.3x
| | 1.9x
| | 2.2x
| | 2.4x
| | President & CEO / 4th Highest Paid
| | WBI Holdings, Inc.
| | 2.1x
| | 2.6x
| | 2.9x
| | 2.2x
| | 2.4x
| | 3.0x
| | President & CEO / 5th Highest Paid
| | Combined Utility Group (2)
| | 2.3x
| | 2.8x
| | 3.2x
| | 2.4x
| | 3.1x
| | 4.1x
| |
| | (1)
| Performance graph peer group compensation data compiled by Towers Watson from most recent proxy statements as of July 2010.
| (2)
| Combined Utility Group consists of Montana-Dakota Utilities Co., Great Plains Natural Gas Co., Cascade Natural Gas Corporation, and Intermountain Gas Company
| *
| The information in the table is based solely upon information provided by Towers Watson and is not deemed filed or a part of this compensation discussion and analysis for certification purposes
|
The salary grades give the compensation committee determines where, relativeflexibility to the midpoint of eachassign different salaries to individual executives within a salary grade an individual’s base salary should be based onto reflect one or more of the following: | | • | executive’s performance on financial goals and on non-financial goals, including the results of the performance assessment program | | | • | executive’s experience, tenure, and future potential | | | • | position’s relative value compared to other positions within the company | | | • | relationship of the salary to the competitive salary market value | | | • | internal equity with other executives and | | | • | economic environment of the corporation or executive’s business unit.segment. |
No changes were made in the salary grade classifications of the named executive officers for 2012, and after reviewing the competitive analysis, the compensation committee made no changes in the base salary ranges associated with each named executive officer’s salary grade classification. Our named executive officers’ salary grade classifications for 2012 are listed below, along with the base salary ranges associated with each classification: | | | | | | | | | | | | | | | | | 2012 Base Salary (000s) | Position | | Grade | | Name | | Minimum
($) | | Midpoint
($) | | Maximum
($) | President and CEO | | K | | Terry D. Hildestad | | 620 | | 775 | | 930 | Vice President and CFO | | I | | Doran N. Schwartz | | 260 | | 325 | | 390 | President and CEO, WBI Holdings, Inc. | | J | | Steven L. Bietz | | 312 | | 390 | | 468 | President and CEO, Fidelity Exploration & Production Company | | J | | J. Kent Wells | | 312 | | 390 | | 468 | Executive Vice President – Bakken Development | | J | | William E. Schneider | | 312 | | 390 | | 468 |
| | Performance Assessment Program | Our performance assessment program rates performance of our executive officers, except for our chief executive officer, in the following areas, which help determine actual salaries within the range of salaries associated with the executive’s salary grade: |
| | | | • | visionary leadership | • | leadership | • | strategic thinking | • | mentoring | • | leading with integrity | • | relationship building | • | managing customer focus | • | conflict resolution | • | financial responsibility | • | organizational savvy | • | achievement focus | • | safety | • | judgment | • | Great Place to Work ®risk management
| • | planning and organization | | |
An executive’s overall performance in our performance assessment program is rated on a scale of one to five, with five as the highest rating denoting distinguished performance. An overall performance above 3.75 is considered commendable performance. The chief executive officer assessed each other named executive officer’s performance under the performance assessment program, and the compensation committee, as well as the full board of directors, assessed the chief executive officer’s performance. The board of directors rates our chief executive officer’s performance in the following areas:
| | | | •
| leadership
| •
| succession planning
| •
| integrity and values
| •
| human resources
| •
| strategic planning
| •
| external relations
| •
| financial results
| •
| board relations
| •
| communications
| | |
| | | | | | MDU Resources Group, Inc. Proxy Statement | 2119
|
The board of directors rates our chief executive officer’s performance in the following areas: | | | | • | leadership | • | succession planning | • | integrity and values | • | human resources | • | strategic planning | • | external relations | • | financial results | • | board relations | • | communications | • | risk management |
Our chief executive officer’s performance was rated on a scale of one to five, with five as the highest rating denoting performance well above expectations. Base Salaries of the Named Executive Officers for 2012 | Base Salaries of the Named Executive Officers for 2011Terry D. Hildestad
| In recognition ofThe compensation committee recommended a 6.67% salary increase for Mr. Hildestad for 2012, which would have raised his salary from $750,000 to $800,000 ($775,000 being the continued challengingmarket median). The compensation committee’s rationale for the increase was
|
| | • | his high performance evaluation | | | • | his high integrity, excellent business know how, and ability to work effectively with the management team and the board | | | • | his effectiveness in navigating the company through a difficult economic environment and our efforts to control costs, the compensation committee determined that, except for Mr. Schwartz, there would be no base | | | • | his salary increases for 2011. The compensation committee had alsobeen frozen 2010 base salaries at their 2009 levels for our named executive officers, except for Mr. Schwartz who received an increase in connection with his promotion to chief financial officer in 2010. Determination of Mr. Wells’ base salary is discussed below.since January 1, 2009. |
Mr. Hildestad, however, did not accept his base salary increase for 2012 in order to be treated the same as other Section 16 officers who did not receive a salary increase for 2012. | Doran N. Schwartz | Mr. Schwartz was elected vice president and chief financial officer effective February 17, 2010. For 20112012, the compensation committee awarded Mr. Schwartz a 5.0%9.9% increase, raising his 20102012 salary from $260,000$273,000 to $273,000.$300,000, or 92% of the midpoint of salary grade I for 2012. The compensation committee’s rationale for the increase was in recognition of: |
| | ���
| Mr. Schwartz’s commendable job in transitioning into his new position of chief financial officer in 2010
| | | • | his salary equaling the minimum of his salary grade
| | | •
| his leadership in helping reduce our 2011 corporate overhead expense budget by approximately $700,000 and
| | | •
| his assistance in the company achieving a return on invested capital of 7.5%6.9% for the twelve months ending June 20102011 as compared to the median return on invested capital of 6.4%6.0% for companies in our performance graph peer group over the same time period.period | | • | his success at building good working relationships with shareholders, rating agencies, and the financial community and | | • | moving his salary closer to the midpoint of salary grade I. |
| Steven L. Bietz | Mr. Bietz received no salary increase for 2012 because the compensation committee wanted to limit salary cost increases. | | J. Kent Wells | WhenMr. Wells received no salary increase for 2012 because he had just started his employment with the board initiatedcompany in May 2011 with a searchsalary above the maximum for a president and chief executive officer of Fidelity & Exploration Company, Mr. Hildestad directed the human resources department to conduct a competitive assessment to determine the remuneration necessary to recruit a qualified individual. The competitive assessment was done in January 2011. Using information collected from most recent public company proxy statements by Equilar, Inc., an independent data collection firm, the human resources department’s analysis looked at 2009 compensation data for chief executive officer positions at companies in the following Standard Industrial Classification (SIC) codes:his salary grade.
| | | •
| 1311 – Crude Petroleum and Natural GasWilliam E. Schneider
| | | •
| 1321 – Natural Gas Liquids
| | | •
| 1381 – Drilling OilMr. Schneider received no salary increase for 2012 because his salary was 115% of the market value for his position and Gas Wells and
| | | •
| 1382 – Oil and Gas Field Exploration Services.the compensation committee wanted to limit salary cost increases.
|
Revenue ranged from $250 million to $850 million with median revenue of $591 million at the 36 companies surveyed. These companies are listed on Exhibit C.
The competitive assessment measured base salary, target annual cash compensation, which was base salary plus annual discretionary bonus plus target annual non-equity incentive plan compensation, and target total direct compensation, which was target annual cash compensation plus the target value of long term incentives plus the change in pension and non-qualified deferred compensation plus all other compensation as reported in a company’s proxy statement. The results of the competitive analysis were:
| | | | | Compensation Item | | | CEO Data | | Base Salary (median) | | $ | 559,961 | | Target Annual Cash Compensation (median) | | $ | 1,050,000 | | Target Total Direct Compensation (median) | | $ | 2,337,003 | |
Mr. Wells’ base salary of $550,000 approximated the median base salary of $559,961 paid to chief executive officers in the competitive assessment. We determined that Mr. Wells’ base salary should be close to the median paid to chief executive officers and above the maximum for his salary grade level because we determined that level was necessary to recruit Mr. Wells for this position.
| | | | | | 2220
| MDU Resources Group, Inc. Proxy Statement |
The following table shows each named executive officer’s base salary for 2010 and 2011 and the percentage change:
| | | | | | | | | | | Name | | Base Salary
for 2010
(000s)
($) | | Base Salary
for 2011
(000s)
($) | | % Change
(%) | | Terry D. Hildestad | | | 750.0 | | | 750.0 | | | 0.0 | | Doran N. Schwartz (1) | | | 260.0 | | | 273.0 | | | 5.0 | | J. Kent Wells (2) | | | n/a | | | 550.0 | | | n/a | | John G. Harp | | | 450.0 | | | 450.0 | | | 0.0 | | William E. Schneider | | | 447.4 | | | 447.4 | | | 0.0 | |
| | (1)
| Elected vice president and chief financial officer effective February 17, 2010. Salary shown is not prorated.
| (2)
| Hired May 2, 2011, as president and chief executive officer of Fidelity Exploration & Production Company. Salary shown is not prorated.
|
20112012 Annual Incentives
What the Performance Measures Are and Why We Chose Them The compensation committee develops and reviews financial and other corporate performance measures to help ensure that compensation to the executives reflects the success of their respective business unitsegment and/or the corporation, as well as the value provided to our stockholders. For all business segment chief executive officers, including Messrs. Wells, Harp,Wells and Schneider,Bietz, the performance measures for annual incentive awards are their respective business unit’s annual return on invested capital results compared to target and their respective business unit’s | | • | their respective business segment’s annual return on invested capital results compared to target | | | • | their respective business segment’s allocated earnings per share results compared to target and | | | • | the company’s consolidated earnings per share compared to a target of $1.19. |
The compensation committee added the third performance measure, consolidated earnings per share, results compared to target, with Mr. Wells’ 2011 annual incentivefor the first time in 2012. The compensation committee weighted the 2012 performance measures for Messrs. Wells and Bietz at 75% for Fidelity Exploration & Production Companytheir business segment performance measures (weighted evenly) and 25% for WBI Holdings, Inc. For the named executive officers working at MDU Resources Group, Inc. in 2011,2012, who were Messrs. Hildestad, Schwartz, and Schwartz,Schneider, the compensation committee based 20112012 annual incentives on the weighted averageachievement of performance goals at the incentive payments made tobusiness segments: (i) the chief executive officers of MDU Construction Services Group, Inc., Knife River Corporation, WBI Holdings, Inc.,construction materials and contracting and construction services segments, (ii) the Combined Utility Group, which consists of Montana-Dakota Utilities Co., Great Plains Natural Gas Co., Cascade Natural Gas Corporation,pipeline and Intermountain Gas Company.energy services segment, (iii) the exploration and production segment, and (iv) the electric and natural gas distribution segments. The compensation committee’s rationale for this approach was to provide greater alignment between the MDU Resources Group, Inc. executives and the business unit executives’ annual incentive payments andsegment performance. This methodology requires that all business unit executives receive a maximum annual incentive payment before the MDU Resources Group, Inc. executives receive a maximum annual incentive payment. The compensation committee believes earnings per share and return on invested capital are very good measurements in assessing a business unit’ssegment’s performance and the company’s performance from a financial standpoint.perspective. Earnings per share is a generally accepted accounting principle measurement and is a key driver of stockholder return over the long-term. Return on invested capital measures howmeasure show efficiently and effectively management deploys capital. Sustained returns on invested capital in excess of a business unit’ssegment’s cost of capital create value for our stockholders. Allocated earnings per share for a business unitsegment is calculated by dividing that business unit’ssegment’s earnings by the business unit’ssegment’s portion of the total company weighted average shares outstanding. Return on invested capital for a business unitsegment is calculated by dividing the business unit’ssegment’s earnings, without regard to after tax interest expense and preferred stock dividends, by the business unit’ssegment’s average capitalization for the calendar year. The compensation committee determines the weighting of the performance measures each year based upon recommendations from the chief executive officer. The compensation committee maintained the 2011 performance measure weightings at 50% each because the compensation committee believes both measures are equally important in driving stockholder value in the short term and long term.
We establish our incentive plan performance targets in connection with our annual financial planning process, where we assess the economic environment, competitive outlook, industry trends, and company specific conditions to set projections of results. The compensation committee evaluates the projected results and uses this evaluation to establish the incentive plan performance targets based upon recommendation of the chief executive officer. The compensation committee also considers annual change inIn determining where to set the return on invested capital measure in establishing targets to help ensure that return on invested capital will equal or exceedtarget, the compensation committee considers the business segment’s weighted average cost of capital over time.capital. The weighted average cost of capital is a composite cost of the individual sources of funds including equity and debt used to finance a company’s assets. It is calculated by averaging the cost of debt plus the cost of equity by the proportion each represents in our, or the business segment’s, capital structure. For 2011,2012, the compensation committee chose to use the return on invested capital target for each business segment as approved by | | | | | MDU Resources Group, Inc. Proxy Statement
| 23
|
the board in the 20112012 business plan. Furthermore,plan, except for the construction services segment, which had a target higher than the 2012 business plan to incentivize efforts for that segment to achieve its weighted average cost of capital within five years. The compensation committee continued its 2010 practice and imposed an additional requirement for the 20112012 return on invested capital portion of the annual incentives except for the Combined Utility Group. Results aboveconstruction materials and contracting segment, the 2011 return on invested capital target would not generateconstruction services segment, and the exploration and production segment. The additional annual incentive compensation forrequirement was the business unit executives, unless 2011 return on invested capital results met or exceeded a business unit’ssegment needed to achieve its weighted average cost of capital. In that case, the business unit chief executive officer could earncapital in order to achieve 200% of the annual incentive target attributable to the return on invested capital portion of the annual incentive. However, payments with respect to 2012 return on invested capital results above the 2012 target but below the weighted average cost of capital would be interpolated, in order to motivate these executives to achieve performance levels between the return on invested capital performance targets and the weighted average cost of capital for their respective business segments. | | | MDU Resources Group, Inc.Proxy Statement | 21 |
What the Named Executive Officers’ 2012 Incentive Targets Are and Why We Chose Them
The compensation committee established the named executive officers’ annual incentive targets as a percentage of each officer’s actual 20112012 base salary.
Messrs. Hildestad’s, Harp’s,Schwartz‘s, and Schneider’s 20112012 target annual incentiveincentives were 100%, 65%50%, and 65% of base salary, respectively. The compensation committee determined the 20112012 annual incentive targets would remain unchanged from 2010. The compensation committee’s rationale2011 for this decision wasthese named executives based on the competitive assessments. Specifically, the annual incentive target of 100% of base salary for Mr. Hildestad was within the 82% to 135% range of incentives for chief executive officer positions. The annual incentive targets of 65% for Messrs. Harp and Schneider were within the 43% to 71% range of incentives for business unit president and chief executive officer positions. The compensation committee believed, based on internal equity, that there should be a uniform annual incentive target for these two business unit president and chief executive officer positions. Mr. Schwartz’s annual incentive target was 50% of base salary and also remained unchanged from 2010. Mr. Schwartz’s annual incentive target was below the 55% target identified by Towers Watson in its competitive assessment. The committee’s rationale for the slightly lower annual incentive target was to reflect Mr. Schwartz’s recent promotion to vice president and chief financial officer. Mr. Wells’ annual incentive target is discussed below.following reasons: Terry D. Hildestad and Doran N. Schwartz
As discussed above, Messrs. Hildestad and Schwartz were awarded 2011 incentives based on the weighted average of the payments made to the business unit chief executive officers, with each payment weighted by the business unit’s average invested capital for 2011. The award opportunities and results for the four business units are discussed below.
As a result of the awards earned by the chief executive officers of the business units, Messrs. Hildestad and Schwartz earned 127.3% of their target awards, resulting in a payment of $954,750 for Mr. Hildestad and $173,765 for Mr. Schwartz.
John G. Harp – MDU Construction Services Group, Inc.
The 2011 award opportunity available to Mr. Harp ranged from no payment if the results were below the 85% level to a 200% payout if:
| | • | For Mr. Hildestad, the annual incentive target of 100% of base salary was slightly above the 86% of base salary paid to chief executive officer positions based on salary survey data from the competitive assessment. The committee believed this difference was too small to warrant a change in Mr. Hildestad’s 2012 incentive target. | | | • | For Mr. Schwartz, the annual incentive target of 50% of base salary was slightly below 57% of base salary paid to chief financial officers based on salary survey data from the competitive assessment. The committee believed this difference was too small to warrant a change in Mr. Schwartz’s 2012 incentive target. | | | • | For Mr. Schneider, the compensation committee determined his 2012 incentive target should remain the same from 2011 because of the importance the company placed on his new role of leveraging opportunities in the Bakken that would cut across all of the company’s business segments. There was no competitive data compiled on his position. |
Mr. Bietz’s 2012 target annual incentive was 65% of base salary. The compensation committee determined the 2012 annual incentive target would remain unchanged from 2011 for Mr. Bietz because the annual incentive based on salary survey data from the competitive assessment was 62% of base salary. The committee believed this difference was too small to warrant a change in Mr. Bietz’s 2012 target annual incentive. Mr. Wells’ 2012 incentive target was 125% of bases salary, which was increased from 100% of base salary. The committee raised Mr. Wells’ annual incentive target to mitigate the impact of the added company earnings per share goal and to reflect his business segment’s impact on overall company results. The committee recognized the significant investment that his business segment will make and the desire to incentivize and motivate Mr. Wells to generate earnings that can greatly impact overall company earnings. Named Executive Officers’ 2012 Incentive Payments Terry D. Hildestad, Doran N. Schwartz, and William E. Schneider
As discussed above, Messrs. Hildestad, Schwartz, and Schneider were awarded 2012 incentives based on achievement of performance goals at the business segments. The award opportunities and results for the business segments are discussed below. As a result of the performance goals achieved at the business segments, Messrs. Hildestad, Schwartz, and Schneider earned 69.1% of their target awards, resulting in a payment of $518,250 for Mr. Hildestad, $103,650 for Mr. Schwartz, and $200,950 for Mr. Schneider. Pipeline and Energy Services Segment
For the pipeline and energy services segment, the 2012 award opportunity was comprised of three components: | | | • | The pipeline and energy services segment component represented 75% of the target award, and payout could range from no payment if the results were below the 85% level to a 200% payout if: | | | | | o | the 2012 allocated earnings per share for MDU Construction Services Group, Inc.the segment were at or above the 115% level and | | | | •
| o | the 20112012 return on invested capital was at least equal to MDU Construction Services Group, Inc.’s 2011 weighted average cost of capital.or above the 115% level. |
We set Mr. Harp’s 2011 allocated earnings per share and return on invested capital target levels below his 2010 target level and below the 2010 actual level. Both 2011 target levels reflected significant uncertainty in the overall construction market and anticipated lower margins due to more competitive bids on construction projects. MDU Construction Services Group, Inc.’s 2011 earnings per share and return on invested capital were 186.6% and 160.0% of their respective 2011 targets. Mr. Harp’s payment with respect to the return on invested capital component was limited to the target amount of $146,250 because MDU Construction Services Group, Inc.’s return on invested capital was less than its weighted average cost of capital, resulting in an overall payment of $438,750, or 150% of Mr. Harp’s 2011 target annual incentive.
William E. Schneider – Knife River Corporation
The 2011 award opportunity for Mr. Schneider ranged from no payment if the results were below the 85% level to a 200% payout if:
| | | • | the 2011 allocatedThe MDU Resources Group, Inc. earnings per share for Knife River Corporationcomponent represented 25% of the award and payout could range from no payment if the results were atbelow the $1.19 to a 200% payout if the results were $1.37 or above the 115% level andhigher.
| | | | • | the 2011 return on invested capitalThe pipeline and energy services segment also had five individual goals relating to safety results with each goal that was at least equal to Knife River Corporation’s 2011 weighted average cost of capital.
|
| | | | | 24
| MDU Resources Group, Inc. Proxy Statement
|
We setnot met reducing the 2011 allocated earnings per share and return on invested capital target levels below the 2010 target levels and the 2010 actual results. The 2011 target levels reflected a greater share of business coming from public sector projects, which generally carry lower profit margins. Also, 2011 target levels were lower than 2010 target levels due in part to the absence of earnings gains on the sales of property and equipment. Knife River Corporation’s 2011 results for allocated earnings per share and return on invested capital were 115.0% and 109.4% of their respective targets. Mr. Schneider’s payment with respect to the return on invested capital component was limited to the target amount of $145,405 because Knife River Corporation’s return on invested capital was less than its weighted average cost of capital, resulting in an overall payment of $436,215, or 150% of Mr. Schneider’s 2011 target annual incentive.
WBI Holdings, Inc.
For WBI Holdings, Inc., the 2011 award opportunity for its president and chief executive officer ranged from no payment if the results were below the 85% level to a 200% payout if:
| | •
| the 2011 allocated earnings per share for WBI Holdings, Inc. were at or above the 115% level
| | | •
| the 2011 return on invested capital was at least equal to WBI Holdings, Inc.’s 2011 weighted average cost of capital and
| | | •
| the five safety goals were met.
|
We set the 2011 allocated earnings per share and return on invested capital target levels slightly below the 2010 target levels and below the 2010 actual results. The 2011 target levels were based on lower natural gas prices and higher depletion, depreciation, and amortization amounts. WBI Holdings, Inc.’s 2011 results for allocated earnings per share and return on invested capital were 99.5% and 100.0% of their respective targets, resulting in a potential payment of 98.8% of the president and chief executive officer of WBI Holdings, Inc.’s 2011 target annual incentive.
The president and chief executive officer of WBI Holdings, Inc. also had five individual goals relating to WBI Holdings, Inc.’s safety results with each goal that was not met reducing his annual incentive award by 1%. The five individual goals were:
| | | •
| o | each established local safety committee will conduct 8eight meetings per year | | | | •
| o | each established local safety committee must conduct 4four site assessments per year | | | | •
| o | report vehicle accidents and personal injuries by the end of the next business day | | | | •
| o | achieve the targeted vehicle accident incident rate of 2.52.25 or less and | | | | •
| o | achieve the targeted personal injury incident rate of 2.0 or less. |
One of the five safety goals was not met because WBI Holdings, Inc.’s personal injury incident rate was 3.13. Therefore, the incentive payment was reduced from 98.8% to 97.8% of the 2011 target annual incentive.
Combined Utility Group
For the Combined Utility Group, the 2011 award opportunity for its president and chief executive officer ranged from no payment if the allocated earnings per share and return on invested capital results were below the 85% level to a 200% payout if results were at or above the 115% level.
We set the 2011 targets for allocated earnings per share and return on invested capital targets higher than the 2010 targets but lower than 2010 actual results to reflect a deferred income tax credit in 2010 that did not recur in 2011. For 2011, the Combined Utility Group’s 2011 earnings per share and return on invested capital exceeded their respective 2011 targets. As a result, the president and chief executive officer of the Combined Utility Group was paid 136.7% of the 2011 target annual incentive.
J. Kent Wells
In connection with his hire, the compensation committee granted Mr. Wells an annual incentive opportunity pursuant to the WBI Holdings, Inc. Executive Incentive Compensation Plan. Mr. Wells’ annual incentive target was set at 100% of his base salary. The committee’s rationale was the 100% annual incentive target would drive a target annual cash compensation of $1.1 million, which approximated the target annual cash compensation paid to chief executive officers listed in the competitive assessment. For 2011, the committee guaranteed a minimum payment of 100% of target, prorated to reflect his May 2, 2011 hire date.
| | | | 22 | MDU Resources Group, Inc.Proxy Statement |
The committee set the pipeline and energy services segment’s 2012 allocated earnings per share and return on invested capital below the 2011 target levels and below the 2011 actual results. The 2012 target levels were based on lower natural gas prices and, as a result, lower storage and gas transmission activity. The committee set the MDU Resources Group, Inc. earnings per share target at $1.19 because it was equal to the 2011 result, and the committee believed tying 25% of the incentive award to delivering at least $1.19 in 2012 was appropriate. The pipeline and energy services segment’s 2012 earnings per share and return on invested capital were 179.8% and 143.1% of their respective 2012 targets, equating to 200% of the target amount attributable to that component. Also, MDU Resources Group, Inc.’s 2012 earnings per share results were $(.01), equating to 0% of the target amount attributable to that component. Results at the pipeline and energy services segment (before adjustment for the five safety goals) were 150% of the 2012 target annual incentive. One of the five safety goals was not met because WBI Energy’s personal injury incident rate was 2.67. Therefore, the incentive results were reduced from 150% to 148.5% of the 2012 target annual incentive. Exploration and Production Segment For the exploration and production segment, the 2012 award opportunity was comprised of two components:
| | | • | The exploration and production business segment component represented 75% of the target award, and payout could range from no payment if the results were below the 85% level to a 200% payout if: | | | | | o | the 2012 allocated earnings per share for the segment were at or above the 115% level and | | | | | o | the 2012 return on invested capital was at least equal to the segment’s 2012 weighted average cost of capital. | | | | • | The MDU Resources Group, Inc. earnings per share component represented 25% of the award and payout could range from no payment if the results were below the $1.19 target to a 200% payout if the results were $1.37 or higher. |
The committee set the exploration and production segment’s 2012 allocated earnings per share and return on invested capital target levels below the 2011 actual results. The 2012 allocated earnings per share target level was above the 2011 target level, and the 2012 return on invested capital target level was below the 2011 target level. The 2012 target levels were based on lower natural gas prices and higher depletion, depreciation, and amortization amounts. The committee set the MDU Resources Group, Inc. earnings per share target at $1.19 because it was equal to the 2011 result, and the committee believed tying 25% of the incentive award to delivering at least $1.19 in 2012 was appropriate. This segment’s 2012 earnings per share and return on invested capital were negative equating to no payment on either component. Also, MDU Resources Group, Inc.’s 2012 earnings per share results were $(.01), equating to 0% of the target amount attributable to that component. Overall results for 2012 were 0%. Construction Services and Construction Materials and Contracting Segments For purposes of determining the annual incentive awards of the MDU Resources Group, Inc. executives and the chief executive officer of these segments, these segments were combined. The 2012 award opportunity was comprised of three components:
| | | • | The construction services segment component represented 37.5% of the target award, and payout could range from no payment if the results were below the 85% level to a 200% payout if: | | | | | o | the 2012 allocated earnings per share for the segment were at or above the 115% level and | | | | | o | the 2012 return on invested capital was at least equal to the segment’s 2012 weighted average cost of capital. | | | | • | The construction materials and contracting segment component represented 37.5% of the award, and payment could range from no payment if the results were below the 85% level to a 200% payout if: | | | | | o | the 2012 allocated earnings per share for the segment were at or above the 115% level and | | | | | o | the 2012 return on invested capital was at least equal to the segment’s 2012 weighted average cost of capital. | | | | • | The MDU Resources Group, Inc. earnings per share component represented 25% of the award and payout could range from no payment if the results were below the $1.19 target to a 200% payout if the results were $1.37 or higher. |
| | | | MDU Resources Group, Inc.Proxy Statement | 23 |
The committee set the construction services business segment’s 2012 allocated earnings per share and return on invested capital target levels above the 2011 target levels and below the 2011 actual results. The construction materials and contracting business segment’s 2012 allocated earnings per share target level was set below the 2011 target level and 2011 actual results, and the 2012 return on invested capital target level was set above the 2011 target level and equal to the 2011 actual results. The 2012 target levels reflected significant uncertainty in the overall construction market, including an absence of a federal highway bill and continued low margins due to competitive bids on construction projects. The committee set the MDU Resources Group, Inc. earnings per share target at $1.19 because it was equal to the 2011 result, and the committee believed tying 25% of the incentive award to delivering at least $1.19 in 2012 was appropriate. The construction services segment’s 2012 earnings per share and return on invested capital were 226.6% and 205.4% of their respective 2012 targets, equating to 200% of the target amount attributable to that component. The construction materials and contracting segment’s 2012 earnings per share and return on invested capital were 158.1% and 117.1% of their respective 2012 targets, equating to 155.9% of the target amount attributable to that component. MDU Resources Group, Inc.’s 2012 earnings per share results were $(.01), equating to 0% of the target amount attributable to that component. Overall results for 2012 were 133.5% of the 2012 target annual incentive award. Electric and Natural Gas Distribution Segments
For the electric and natural gas distribution segments, the 2012 award opportunity was comprised of two components: | | | • | the electric and natural gas distribution business segments component represented 75% of the target award, and payout could range from no payment if the allocated earnings per share and return on invested capital results were below the 85% level to a 200% payout if: | | | | | o | the 2012 allocated earnings per share for the segment were at or above the 115% level and | | | | | o | the 2012 return on invested capital was at or above the 115% level. | | | | • | The MDU Resources Group, Inc. earnings per share component represented 25% of the award and payout could range from no payment if the results were below the $1.19 target to a 200% payout if the results were $1.37 or higher. |
The committee set the 2012 target for allocated earnings per share higher than the 2011 targets but lower than 2011 actual results to reflect a one-time income tax benefit in 2011. The committee set the 2012 return on invested capital target at the 2011 target level, which was below 2011 actual results to reflect a one-time income tax benefit in 2011. For 2012, the electric and natural gas distribution segments’ 2012 earnings per share and return on invested capital were 93.1% and 93.6% of their respective targets, equating to 66.7% of the target amount attributable to that component. MDU Resources Group, Inc.’s 2012 earnings per share results were $(.01), equating to 0% of the target amount attributable to that component. Overall results for these segments were 50% of the 2012 target annual incentive award. The following table shows the changes in our performance targets and achievements for both 2011 and 2012: | | | 2011
Incentive Plan
Performance
Targets | | 2011
Incentive
Plan Results | | 2012
Incentive Plan
Performance
Targets | | 2012
Incentive
Plan Results | | | | | | | | | | | | | | | | | | EPS | | | | EPS | | | | | | | | | | | | EPS | | | | EPS | | Business | | | | MDU | | | | | | | | | | | | Business | | | | MDU | | Segment | | ROIC | | Resources | | | | EPS | | ROIC | | EPS | | ROIC | | Segment | | ROIC | | Resources | | ($) / (% of | | (%) / (% of | | ($) / (% of | | Name | | ($) | | (%) | | ($) | | (%) | | ($) | | (%) | | ($) | | Target) | | Target) | | Target) | | Pipeline and Energy Services | | 1.97 | | 7.9 | | 1.96 | | 7.9 | | 0.99 | | 5.8 | | 1.19 | | 1.78 / 200 | | 8.3 / 200 | | (.01) / 0 | | Exploration and Production | | 1.99 | | 7.1 | | 2.20 | | 7.9 | | 2.10 | | 6.9 | | 1.19 | | (4.81) / 0 | | (13.9) / 0 | | (.01) / 0 | | Construction Services | | 2.39 | | 6.0 | | 4.46 | | 9.6 | | 3.61 | | 7.4 | | 1.19 | | 8.18 / 200 | | 15.2 / 200 | | (.01) / 0 | | Construction Materials and Contracting | | 0.35 | | 3.2 | | 0.40 | | 3.5 | | 0.31 | | 3.5 | | 1.19 | | 0.49 / 200 | | 4.1 / 111.8 | | (.01) / 0 | | Electric and Natural Gas Distribution | | 1.14 | | 6.2 | | 1.21 | | 6.5 | | 1.16 | | 6.2 | | 1.19 | | 1.08 / 65.5 | | 5.8 / 67.8 | | (.01) / 0 |
| | | | 2524
| MDU Resources Group, Inc. Proxy Statement |
The 2011 incentive award opportunity was based on the financial goals for both Fidelity Exploration & Production Company and WBI Holdings, Inc., weighted 75% for the results of Fidelity Exploration & Production Company and 25% for the results of WBI Holdings, Inc. The incentive award could be reduced by up to 10% if Fidelity Exploration & Production Company did not meet its production goal and by up to 5% if WBI Holdings, Inc. did not satisfy its safety goals. Mr. Wells could achieve a maximum of 200% of the annual incentive target if: | | •
| the 2011 allocated earnings per share for Fidelity Exploration & Production Company and the 2011 allocated earnings per share for WBI Holdings, Inc., were at or above 115% of the performance target
| | | •
| the 2011 return on invested capital for Fidelity Exploration & Production Company and the 2011 return on invested capital for WBI Holdings, Inc. were both at least equal to their respective weighted average costs of capital
| | | •
| Fidelity Exploration & Production Company achieved production of at least 69.3 billion cubic feet equivalent (Bcfe), and
| | | •
| the five safety goals for WBI Holdings, Inc. were met.
|
Financial Goals and Results
We set the 2011 earnings per share and return on invested capital targets for Fidelity Exploration & Production Company and WBI Holdings, Inc. lower than 2010 target levels and lower than 2010 actual results based on lower natural gas prices and higher depletion, depreciation, and amortization expense.
Fidelity Exploration & Production Company’s earnings per share and return on invested capital exceeded their respective targets, but Mr. Wells’ payment with respect to the return on invested capital component was limited to the target amount because its return on invested capital was less than its weighted average cost of capital. WBI Holdings, Inc.’s 2011 results are discussed earlier under 2011 Annual Incentives – WBI Holdings, Inc. The weighted financial results for Fidelity Exploration & Production Company and WBI Holdings, Inc. resulted in an achievement of 126.1% of the incentive target. This resulted in a potential payment to Mr. Wells of $462,390, which was subject to reduction if Fidelity Exploration & Production Company’s production goal was not met and/or WBI Holdings, Inc. failed to achieve one or more of its five 2011 safety goals.
Fidelity Exploration & Production Company Production and WBI Holdings, Inc. Safety Goals and Results
| | Fidelity Exploration & Production Company | | 2011 Production in Bcfe | Goal Achievement Percentage | Less than 62.4 | 0% | 62.4 | 50% | Higher than 62.4 up to and including 69.3 | Prorated from 50% to 100% | Higher than 69.3 | 100% |
Fidelity Exploration & Production Company’s 2011 actual production was 66.6 Bcfe, which equates to an achievement percentage of 80.5%.
The five WBI Holdings, Inc. safety goals were:
| | •
| each established local safety committee will conduct 8 meetings per year
| | | •
| each established local safety committee must conduct 4 site assessments per year
| | | •
| report vehicle accidents and personal injuries by the end of the next business day
| | | •
| achieve the targeted vehicle accident incident rate of 2.5 or less and
| | | •
| achieve the targeted personal injury incident rate of 2.0 or less.
|
Even though Fidelity Exploration & Production Company’s personal injury rate was 0.0, WBI Holdings, Inc. did not meet one of its safety goals due to a 2011 personal injury incident rate above 2.0. Achieving four of the five safety goals equates to an achievement percentage of 80.0%.
The production and safety goal results reduced Mr. Wells’ potential award of $462,390 by 2.9% to $448,981. Of the $448,981 payment, $366,685 is the target amount guaranteed in Mr. Wells’ letter agreement and is reported in the Bonus column of the Summary Compensation Table; the additional $82,296 was reported in the Non-Equity Incentive Plan Compensation column of the Summary Compensation Table.
| | | | | 26
| MDU Resources Group, Inc. Proxy Statement
|
The following table shows the changes in our performance targets and achievements for both 2010 and 2011:
| | | | | | | | | | | | | | | | | | | | | | | | | | | | 2010
Incentive Plan
Performance
Targets | | 2010
Incentive
Plan Results | | 2011
Incentive Plan
Performance
Targets | | 2011
Incentive
Plan Results | | Name | | EPS
($) | | ROIC
(%) | | EPS
($) | | ROIC
(%) | | EPS
($) | | ROIC
(%) | | EPS
($) | | ROIC
(%) | | Terry D. Hildestad | | See table below | | See table below | | See table below | | See table below | | Doran N. Schwartz | | See table below | | See table below | | See table below | | See table below | | J. Kent Wells | FEP: 2.08 | | | 7.8 | FEP: 2.41 | | | 8.8 | FEP: 1.99 | | | 7.1 | FEP: 2.20 | | | 7.9 | | | WBI: 2.02 | | | 8.4 | WBI: 2.08 | | | 8.6 | WBI: 1.97 | | | 7.9 | WBI: 1.96 | | | 7.9 | | John G. Harp (1) | | | 2.22 | | | 6.7 | | | 3.46 | | | 9.0 | | | 2.39 | | | 6.0 | | | 4.46 | | | 9.6 | | William E. Schneider (2) | | | 0.54 | | | 4.6 | | | 0.44 | | | 3.9 | | | 0.35 | | | 3.2 | | | 0.40 | | | 3.5 | | WBI Holdings, Inc.
President & CEO | | | 2.02 | | | 8.4 | | | 2.08 | | | 8.6 | | | 1.97 | | | 7.9 | | | 1.96 | | | 7.9 | | Combined Utility Group
President & CEO | | | 1.07 | | | 6.1 | | | 1.17 | | | 6.5 | | | 1.14 | | | 6.2 | | | 1.21 | | | 6.5 | |
| | | (1)
| Based on allocated earnings per share and return on invested capital for MDU Construction Services Group, Inc.
| (2)
| Based on allocated earnings per share and return on invested capital for Knife River Corporation.
| |
The table below lists each named executive officer’s 20112012 base salary, annual incentive target percentage, incentive plan performance targets, incentive plan results, and the annual incentive earned.
| | | | | | | | | | | | | | | | | | | | | | | | | | | | | | | | 2011
Base
Salary | | | 2011
Annual
Incentive | | 2011
Incentive Plan
Performance
Targets | | 2011
Incentive
Plan Results | | | 2011
Annual Incentive
Earned
(% of Target) | | | 2011
Annual
Incentive
Earned | | Name | | | (000s)
($) | | | Target
(%) | | | EPS
($) | | | ROIC
(%) | | | EPS
($) | | | ROIC
(%) | | | EPS
(%) | | | ROIC
(%) | | | (000s)
($) | | Terry D. Hildestad | | | 750.0 | | | 100 | | See table below | | See table below | | See table below | | | 954.8 | | Doran N. Schwartz | | | 273.0 | | | 50 | | See table below | | See table below | | See table below | | | 173.8 | | J. Kent Wells (1) | | | 550.0 | | | 100 | FEP: 1.99 | | | 7.1 | FEP: 2.20 | | | 7.9 | FEP: 170.3 | | | 100 | | | FEP: 353.5 | | | | | | | | | WBI: 1.97 | | | 7.9 | WBI: 1.96 | | | 7.9 | WBI: 97.5 | | | 100 | | | WBI: 95.5 | | John G. Harp (2) | | | 450.0 | | | 65 | | | 2.39 | | | 6.0 | | | 4.46 | | | 9.6 | | | 200.0 | | | 100 | | | 438.8 | | William E. Schneider (3) | | | 447.4 | | | 65 | | | 0.35 | | | 3.2 | | | 0.40 | | | 3.5 | | | 200.0 | | | 100 | | | 436.2 | |
| | (1)
| Based on allocated earnings per share and return on invested capital for Fidelity Exploration & Production Company (weighted 75%) and WBI Holdings, Inc. (weighted 25%). Mr. Wells’ 2011 annual incentive earned reflects a reduction of 2.9% due to Fidelity Exploration & Production Company’s 2011 results on production and WBI Holdings, Inc.’s results on safety.
| (2)
| Based on allocated earnings per share and return on invested capital for MDU Construction Services Group, Inc.
| (3)
| Based on allocated earnings per share and return on invested capital for Knife River Corporation.
| |
| | | | | | | | | | Name | | 2012
Base
Salary
(000s)
($) | | 2012
Annual
Incentive
Target
(%) | | 2012
Annual
Incentive
Earned
(% of Target) | | 2012
Annual
Incentive
Earned
(000s)
($) | | Terry D. Hildestad | | 750.0 | | 100 | | 69.1 | | 518.3 | | Doran N. Schwartz | | 300.0 | | 50 | | 69.1 | | 103.7 | | Steven L. Bietz | | 360.5 | | 65 | | 148.5 | | 348.0 | | J. Kent Wells | | 550.0 | | 125 | | 0.0 | | 0.0 | | William E. Schneider | | 447.4 | | 65 | | 69.1 | | 201.0 | |
Messrs. Hildestad’s, Schwartz’s, and Schwartz’s 2011Schneider’s 2012 annual incentives were paid at 127.3%69.1% of target based on the following: | | | | | | | | | | | Chief Executive Officer of: | | | Column A
2011 Payment as a
Percentage of Annual
Incentive Target | | Column B
Percentage of
Average Invested
Capital | Column A x Column B | | | MDU Construction Services Group, Inc. | | | 150.0 | % | | 6.1 | % | | 9.2 | % | Knife River Corporation | | | 150.0 | % | | 24.4 | % | | 36.6 | % | WBI Holdings, Inc. | | | 97.8 | % | | 34.6 | % | | 33.8 | % | Combined Utility Group | | | 136.7 | % | | 34.9 | % | | 47.7 | % | | | Total | | | | | | | | | 127.3 | % | | |
J. Kent Wells’ Additional 2011 Annual Incentive
We granted Mr. Wells a second 2011 annual incentive award pursuant to the Long-Term Performance-Based Incentive Plan, based on Fidelity Exploration & Production Company’s cash flow from operations. Specifically, we granted Mr. Wells an all-or-nothing award opportunity of $1.85 million, payable one-half in cash and one-half in our common stock, if Fidelity Exploration & Production Company’s 2011 cash flow from operations exceeded $132.0 million and he did not resign from the company prior to January 2, 2012. If Fidelity Exploration & Production Company’s 2011 cash flow from operations exceeded $132.0 million and Mr. Wells’ employment was terminated prior to January 2, 2012, due to a change in control of the company, Mr. Wells would have been entitled to full payment of this incentive award. The compensation committee chose cash flow from operations as the performance measure due to the significance of consistent
| | | | | MDU Resources Group, Inc. Proxy Statement
| 27
|
reinvestment in exploration and production assets. Cash flow from operations is necessary to sustain and grow a business in this industry. The compensation committee set the incentive performance level at $132.0 million, which was below the 2011 operating plan, to provide an allowance for depressed commodity prices and to yield a reasonable probability of payment, as the $1.85 million was in part to offset other compensation Mr. Wells would have received if he had stayed with his former employer.
Fidelity Exploration & Production Company’s actual 2011 cash flow from operations was $276.4 million, resulting in a payment of $1.85 million to Mr. Wells. The cash portion paid to Mr. Wells is reported in the Non-Equity Incentive Compensation Plan column in the Summary Compensation Table, and the grant date fair value of the stock portion of the award is reported in the Stock Awards column of the Summary Compensation Table.
| | | | | | | | | | Column A
Percentage of
Annual Incentive
Target Achieved | | Column B
Percentage of
Average Invested
Capital | | Column A x Column B | | Construction Services Segment and Construction | | | | | | | | Materials and Contracting Segment | | 133.5% | | 29.2% | | 39.0% | | Exploration and Production Segment | | 0.0% | | 28.1% | | 0.0% | | Pipeline and Energy Services Segment | | 148.5% | | 8.8% | | 13.1% | | Electric and Natural Gas Distribution Segments | | 50.0% | | 33.9% | | 17.0% | | Total (Payout Percentage) | | | | | | 69.1% | |
Deferral of Annual Incentive Compensation
We provide executives the opportunity to defer receipt of earned annual incentives. If an executive chooses to defer his or her annual incentive, we will credit the deferral with interest at a rate determined by the compensation committee. For 2011,2012, the committee chose to use the average of (i) the number that results from adding the daily Moody’s U.S. Long-Term Corporate Bond Yield Average for “A” rated companies as of the last day of each month for the 12-month period ending October 31 and dividing by 12 and (ii) the number that results from adding the daily Moody’s U.S. Long-Term Corporate Bond Yield Average for “BBB” rated companies as of the last day of each month for the 12-month period ending October 31 and dividing by 12. This resulted in an interest rate of 5.46%. The compensation committee’s reasons for using this approach recognized: | | • | incentive deferrals are a low-cost source of capital for the company and | | | • | incentive deferrals are unsecured obligations and, therefore, carry a higher risk to the executives. |
20112012 Long-Term Incentives
Awards Granted in 20112012 under the Long-Term Performance-Based Incentive Plan for Named Executives
We use the Long-Term Performance-Based Incentive Plan, which has been approved by our stockholders, for long-term incentive compensation. We use performance shares as the primary form of long-term incentive compensation. We have not granted stock options since 2001, and in 2011 we amended the plan to no longer permit the grant of stock options or stock appreciation rights. We use performance shares as the primary form of long-term incentive compensation, andrights; no stock options, stock appreciation rights, or restricted shares are outstanding.
For the named executives, other than Mr. Wells who did not receive any long-term incentive award in 2011, theThe compensation committee used the performance graph peer group as the comparator group to determine relative stockholder return and potential payments underfor the Long-Term Performance-Based Incentive Plan for its 2011-20132012 performance share awards. In February 2011, the compensation committee approved changes to ourThe performance graph peer group to:
| | •
| remove OGE Energy Corp. because it is an electric only utility
| | | •
| remove NSTAR because it was expected to be acquired by Northeast Utilities in 2011
| | | •
| add Atmos Energy Corporation, a natural gas distribution business with pipeline, gas storage, and energy marketing businesses
| | | •
| remove ONEOK because its asset size has grown to $13 billion
| | | •
| add Southern Union Company, which has natural gas transportation and storage, gathering and processing, and gas distribution businesses
| | | •
| add Texas Industries, Inc. and Sterling Construction Company and
| | | •
| replace Dycom Industries, Inc., which has more emphasis on telecommunications, with Pike Electric, which is a good fit with our construction services business to balance out the business mix of our peer group.
|
| | | | 28
| MDU Resources Group, Inc. Proxy Statement
|
Theconsisted of the following companies comprising ourwhen the committee granted performance graph peer groupshares in February 2011 were:2012:
| | | | | | | | • | Alliant Energy Corporation | | • | Martin Marietta Materials, Inc. | | • | Southwest Gas Corporation | • | Atmos Energy | | • | National Fuel Gas Company | | • | Sterling Construction Company | • | Berry Petroleum Company | | • | Northwest Natural Gas Company | | • | SM Energy Company | • | Black Hills Corporation | | • | Pike Electric Corporation | | • | Swift Energy Company | • | Comstock Resources, Inc. | | • | Quanta Services, Inc. | | • | Texas Industries | • | EMCOR Group, Inc. | | • | Questar Corporation | | • | Vectren Corporation | • | EQT Corporation | | • | SCANA Corporation | | • | Vulcan Materials Company | • | Granite Construction Incorporated | | • | Southern Union Company | | • | Whiting Petroleum Corporation |
| | | | MDU Resources Group, Inc. Proxy Statement | 25 |
The performance measure is our total stockholder return over a three-year measurement period as compared to the total stockholder returns of the companies in our performance graph peer group over the same three-year period. The compensation committee selected the relative stockholder return performance measure because it believes executive pay under a long-term, capital accumulation program such as this should mirror our long-term performance in stockholder return as compared to other public companies in our industries. Payments are made in company stock; dividend equivalents are paid in cash. No dividend equivalents are paid on unvested performance shares. Total stockholder return is the percentage change in the value of an investment in the common stock of a company, from the closing price on the last trading day in the calendar year preceding the beginning of the performance period, through the last trading day in the final year of the performance period. It is assumed that dividends are reinvested in additional shares of common stock at the frequency paid. As with the annual incentive target, we determined the long-term incentive target for a given position by reference to the salary grade. We derived these incentive targets in part from the competitive assessment and in part by the compensation committee’s judgment on the impact each position has on our total stockholder return. The compensationFrom an internal equity standpoint, the committee also believed consistency across positions in the same salary grades andgrade should have the same long-term incentive target level. From an internal equity standpoint, the committee believed in keeping the chief executive officer’s long-term incentive target below a level indicated byfrom the competitive assessment were important from an internal equity standpoint. The 2011 long-term incentive targets as a percentageassessment. Mr. Hildestad’s target was 150% of base salary, below the salary survey median of 231% of base salary for each namedchief executive were unchanged from 2010 because the targets were in line with the competitive assessment’s targets. officers. The compensation committee has historically set Mr. Hildestad’s target long-term incentive compensation below the level indicated by the competitive assessment to offset his benefit under the Supplemental Income Security Plan, our nonqualified defined benefit plan, which prior assessments have shown to be higher than competitive levels. To verify whether Mr. Hildestad’s targetThe 2012 long-term incentive compensation remains lowertargets as a percentage of base salary for Messrs. Schwartz, Bietz, and Schneider were unchanged from 2011 because the targets were in line with the competitive assessment’s targets. Mr. Wells’ long-term incentive target is 200% of base salary, which is higher than competitive levelsthe 90% long-term incentive target for other executives in salary grade J. The higher target for Mr. Wells was pursuant to his letter agreement and whetherreflects the committee’s judgment of offsetting Mr. Hildestad’sWells’ non-participation in our Supplemental Income Security Plan benefit remains higher than competitive levels, our human resources department conducted the review discussed in the Role of Management section above. The report showed that the combined value of Mr. Hildestad’s target long-term incentive compensation and nonqualified defined benefit plan benefits had a percentile rank of 58.4% when compared to the performance graph peer companies and a percentile rank of 43.7% when compared to companies with revenues ranging from $2.5 billion to $6.5 billion in the construction, energy, and utility industries.Plan. On February 17, 2011,16, 2012, the board of directors, upon recommendation of the compensation committee, made performance share grants to the named executive officers. The compensation committee determined the target number of performance shares granted to each named executive officer by multiplying the named executive officer’s 20112012 base salary by his or her long-term incentive target and then dividing this product by the average of the closing prices of our stock from January 1, 20112012 through January 22, 2011,2012, as shown in the following table: | | | | | | | | | | | | | | | | | Name | | 2011
Base
Salary to
Determine
Target
($) | | 2011
Long-Term
Incentive
Target at
Time of
Grant
(%) | | 2011
Long-Term
Incentive
Target at
Time of
Grant
($) | | Average
Closing Price
of Our Stock
From January 1
Through
January 22
($) | | Resulting
Number of
Performance
Shares
Granted on
February 17
(#) | | Terry D. Hildestad | | | 750,000 | | | 150 | | | 1,125,000 | | | 20.74 | | | 54,243 | | Doran N. Schwartz | | | 273,000 | | | 75 | | | 204,750 | | | 20.74 | | | 9,872 | | J. Kent Wells | | | n/a | | | n/a | | | n/a | | | n/a | | | n/a | | John G. Harp | | | 450,000 | | | 90 | | | 405,000 | | | 20.74 | | | 19,527 | | William E. Schneider | | | 447,400 | | | 90 | | | 402,660 | | | 20.74 | | | 19,414 | |
| | | MDU Resources Group, Inc. Proxy Statement
| 29
|
| | | | | | | | | | | | Name | | 2012
Base
Salary to
Determine
Target
($) | | 2012
Long-Term
Incentive
Target at
Time of
Grant
(%) | | 2012
Long-Term
Incentive
Target at
Time of
Grant
($) | | Average
Closing Price
of Our Stock
From January 1
Through
January 22
($) | | Resulting
Number of
Performance
Shares
Granted on
February 16
(#) | | Terry D. Hildestad | | 750,000 | | 150 | | 1,125,000 | | 21.54 | | 52,228 | | Doran N. Schwartz | | 300,000 | | 75 | | 225,000 | | 21.54 | | 10,445 | | Steven L. Bietz | | 360,500 | | 90 | | 324,450 | | 21.54 | | 15,062 | | J. Kent Wells | | 550,000 | | 200 | | 1,100,000 | | 21.54 | | 51,067 | | William E. Schneider | | 447,400 | | 90 | | 402,660 | | 21.54 | | 18,693 | |
Assuming our three-year (2011–2013)(2012 to 2014) total stockholder return is positive, from 0% to 200% of the target grant will be paid out in February 20142015 depending on our total stockholder return compared to the total three-year stockholder returns of companies in our performance graph peer group. The payout percentage will be a function of our rank against our performance graph peer group as follows: Long-Term Incentive Payout Percentages | | | | | The Company’s
Percentile Rank | | Payout Percentage of
February 17, 201116, 2012 Grant | | 90th or higher | | 200 | % | | 70th | | 150 | % | | 50th | | 100 | % | | 40th | | 10 | % | | Less than 40th | | 0 | % | |
| | | | 26 | MDU Resources Group, Inc. Proxy Statement |
Payouts for percentile ranks falling between the intervals will be interpolated. We also will pay dividend equivalents in cash on the number of shares actually earned for the performance period. The dividend equivalents will be paid in 20142015 at the same time as the performance awards are paid. If our total stockholder return is negative, the shares and dividend equivalents otherwise earned, if any, will be reduced in accordance with the following table: | | | | | TSR | | Reduction in Award | | 0% through -5% | | 50 | % | | -5.01% through -10% | | 60 | % | | -10.01% thoughthrough -15% | | 70 | % | | -15.01% through -20% | | 80 | % | | -20.01% through -25% | | 90 | % | | -25.01% or below | | 100 | % | |
The named executive officers must retain 50% of the net after-tax shares that are earned pursuant to this long-term incentive award until the earlier of (i) the end of the two-year period commencing on the date any shares earned under the award are issued and (ii) the executive’s termination of employment. | No Payment in February 2011 for 2008No Payment in February 2012 for 2009 Grants under the Long-Term Performance-Based Incentive Plan
We granted performance shares to our named executive officers under the Long-Term Performance-Based Incentive Plan on February 12, 2009 for the 2009 through 2011 performance period. Our total stockholder return for the 2009 through 2011 performance period was 9.25%, which corresponded to a percentile rank of 25% against our performance graph peer group and resulted in no shares or dividend equivalents being paid to the named executive officers. PEER Analysis: Comparison of Pay for Performance Ratios
Each year we compare our named executive officers’ pay for performance ratios to the pay for performance ratios of the named executive officers in the performance graph peer group. This analysis compares the relationship between our compensation levels and our average annual total stockholder return to the peer group over a five-year period. All data used in the analysis, including the valuation of long-term incentives and calculation of stockholder return, were compiled by Equilar, Inc., an independent service provider, which is based on each company’s annual filings for its data collection.
| We granted performance shares to our named executive officers under the Long-Term Performance-Based Incentive Plan on February 14, 2008, for the 2008 through 2010 performance period. Our total stockholder return for the 2008 through 2010 performance period was (19.98)%, which corresponded to a percentile rank of 33% against our performance graph peer group and resulted in no shares or dividend equivalents being paid to the named executive officers.
| | PEER Analysis: Comparison of Pay for Performance Ratios
| Each year we compare our named executive officers’ pay for performance ratios to the pay for performance ratios of the named executive officers in the performance graph peer group. This analysis compares the relationship between our compensation levels and our average annual total stockholder return to the peer group over a five-year period. All data used in the analysis, including the valuation of long-term incentives and calculation of stockholder return, were compiled by Equilar, Inc., an independent service provider, which is based on each company’s annual filings for its data collection.
| | This analysis consisted of dividing what we paid our named executive officers for the years 2006 through 2010 by our average annual total stockholder return for the same five-year period to yield our pay ratio. Our pay ratio was then compared to the pay ratio of the companies in the performance graph peer group, which was calculated by dividing total direct compensation for all the proxy group executives by the sum of each company’s average annual total stockholder return for the same five-year period. The results are shown in the following chart: |
5 Year Total Compensation to 5 Year Total Stockholder Return
| | | | | | | | | | MDU Resources
Group, Inc.
($000s) | | Performance
Graph
Peer Group
($000s) | *
| Dollars of Total Direct Compensation (1) per Point of Total Stockholder Return | | | 50,369 | | | 12,261 | |
| | (1)
| Total direct compensation consists of the values reported in the total column of the summary compensation table.
| *
| Based solely on information provided by Equilar, Inc. and is not deemed filed or a part of this compensation discussion and analysis for certification purposes.
|
| | | 30
| MDU Resources Group, Inc. Proxy Statement
|
The results of the analysis showed that we paid our named executive officers more than whatfor the years 2007 through 2011 by our average annual total stockholder return for the same five-year period to yield our pay ratio. Our pay ratio was then compared to the pay ratio of the companies in the performance graph peer group, companies paid their named executive officerswhich was calculated by dividing total direct compensation for comparable levelsall the proxy group executives by the sum of each company’s average annual total stockholder return overfor the same five-year period.
For the five-year period. We have prepared this analysis each year since 2004, commencing withperiod of 2007 through 2011, our average annual stockholder return was minus .88%. Therefore, our pay ratio is not a meaningful statistic and a comparison to the 2000-2004 period, andpay ratio of the companies in most years, the analysis showed that we paid our named executive officers less than, or approximately the same as, our performance graph peer group. However, for the 2006-2010 five-year period, our negative total stockholder return in both 2008 and 2010 resulted in a five-year average total stockholder return of 0.98%. This low average caused the ratio to spike, despite decreased total direct compensation, as calculated, for our named executive officers for the period.group could not be made. The compensation committee believes that the analysis continues to serve a useful purpose in its annual review of compensation despite the effect of the negative total stockholder return on the ratio for the 2006-20102007 through 2011 period. Post-Termination Compensation and Benefits
Pension Plans
Effective in 2006, we no longer offer defined benefit pension plans to new non-bargaining unit employees. The defined benefit plans available to employees hired before 2006 were amended to cease benefit accruals as of December 31, 2009. The frozen benefit provided through our qualified defined benefit pension plans is determined by years of service and base salary. Effective 2010, for those employees who were participants in defined benefit pension plans and for executives and other non-bargaining unit employees hired after 2006, the company offers increased company contributions to our 401(k) plan. For non-bargaining unit employees hired after 2006, the retirement contribution is 5% of plan eligible compensation. For participants hired prior to 2006, retirement contributions are based on the participant’s age as of December 31, 2009. The retirement contribution is 11.5% for each of the named executive officers, except Mr. Schwartz who is eligible for 10.5% and Mr. Wells who is eligible for 5%. | | | | MDU Resources Group, Inc. Proxy Statement | 27 |
Supplemental Income Security Plan
Benefits Offered
We offer certain key managers and executives, including all of our named executive officers, except Mr. Wells, benefits under our nonqualified retirement plan, which we refer to as the Supplemental Income Security Plan or SISP. The SISP has a ten-year vesting schedule and was amended to add an additional vesting requirement for benefit level increases occurring on or after January 1, 2010. The SISP provides participants with additional retirement income and death benefits. We believe the SISP is critical in retaining the talent necessary to drive long-term stockholder value. In addition, we believe that the ten-year vesting provision of the SISP, augmented by an additional three years of vesting for benefit level increases occurring on or after January 1, 2010, helps promote retention of key executive officers. Benefit Levels
The chief executive officer recommends benefit level increases to the compensation committee for participants except himself. The chief executive officer considers, among other things, the participant’s salary in relation to the salary ranges that correspond with the SISP benefit levels, the participant’s performance, the performance of the applicable business unitsegment or the company, and the cost associated with the benefit level increase. The chief executive officer did not recommend a 20112012 SISP benefit level increase for any of the named executive officers, and the committee chose not to grant a 20112012 SISP benefit level increase to the chief executive officer. The primary reasons for no benefit level increases were cost containment and the absence of salary increases for our named executive officers, except for Mr. Schwartz whose salary increase did not correspond to a new SISP benefit level. The following table reflects our named executive officers’ SISP levels as of December 31, 2011:2012: | | | | | | | | | | December 31, 2011
Annual SISP Benefits | | Name | | Survivor
($) | | Retirement
($) | | Terry D. Hildestad | | | 1,025,040 | | | 512,520 | | Doran N. Schwartz | | | 175,200 | | | 87,600 | | J. Kent Wells | | | n/a | | | n/a | | John G. Harp | | | 548,400 | | | 274,200 | | William E. Schneider | | | 548,400 | | | 274,200 | |
| | | | MDU Resources Group, Inc. Proxy Statement
| 31
|
| | | | | | | | December 31, 2012
Annual SISP Benefits | | Name | | Survivor
($) | | Retirement
($) | | Terry D. Hildestad | | 1,025,040 | | 512,520 | | Doran N. Schwartz | | 175,200 | | 87,600 | | Steven L. Bietz | | 386,640 | | 193,320 | | J. Kent Wells | | N/A | | N/A | | William E. Schneider | | 548,400 | | 274,200 | |
Clawback
In November 2005, we implemented a guideline for repayment of incentives due to accounting restatements, commonly referred to as a clawback policy, whereby the compensation committee may seek repayment of annual and long-term incentives paid to executives if accounting restatements occur within three years after the payment of incentives under the annual and long-term plans. Under our clawback policy, the compensation committee may require executives to forfeit awards and may rescind vesting, or the acceleration of vesting, of an award. Impact of Tax and Accounting Treatment
The compensation committee may consider the impact of tax and/or accounting treatment in determining compensation. Section 162(m) of the Internal Revenue Code places a limit of $1 million on the amount of compensation paid to certain officers that we may deduct as a business expense in any tax year unless, among other things, the compensation qualifies as performance-based compensation, as that term is used in Section 162(m). Generally, long-term incentive compensation and annual incentive awards for our chief executive officer and those executive officers whose overall compensation is likely to exceed $1 million are structured to be deductible for purposes of Section 162(m) of the Internal Revenue Code, but we may pay compensation to an executive officer that is not deductible. All annual or long-term incentive compensation paid to our named executive officers for 2011in 2012 satisfied the requirements for deductibility.deductibility, except for $48,129 paid to Mr. Wells. Section 409A of the Internal Revenue Code imposes additional income taxes on executive officers for certain types of deferred compensation if the deferral does not comply with Section 409A. We have amended our compensation plans and arrangements affected by Section 409A with the objective of not triggering any additional income taxes under Section 409A. Section 4999 of the Internal Revenue Code imposes an excise tax on payments to executives and others of amounts that are considered to be related to a change of control if they exceed levels specified in Section 280G of the Internal Revenue Code. The potential impactTo the extent a change in control triggers liability for an excise tax, payment of the Section 4999 excise tax is addressed withwill be made by the modified tax payment provisions inindividual. The company will not pay the change of control employment agreements, which are described later in the proxy statement under the heading “Potential Payments upon Termination or Change of Control.”excise tax. We do not consider the potential impact of Section 4999 or 280G when designing our compensation programs. | | | | 28 | MDU Resources Group, Inc. Proxy Statement |
The compensation committee also considers the accounting and cash flow implications of various forms of executive compensation. In our financial statements, we record salaries and annual incentive compensation as expenses in the amount paid, or to be paid, to the named executive officers. For our equity awards, accounting rules also require that we record an expense in our financial statements. We calculate the accounting expense of equity awards to employees in accordance with Financial Accounting Standards Board generally accepted accounting principles for stock-based compensation. Stock Ownership Requirements
We instituted stock ownership guidelines on May 5, 1993, which we revised in November 2010 to provide that executives who participate in our Long-Term Performance-Based Incentive Plan are required within five years to own our common stock equal to a multiple of their base salaries. Stock owned through our 401(k) plan or by a spouse is considered in ownership calculations. Unvested performance shares and other unvested equity awards are not considered in ownership calculations. The level of stock ownership compared to the requirements is determined based on the closing sale price of the stock on the last trading day of the year and base salary at December 31 of each year. Each February, the compensation committee receives a report on the status of stock holdings by executives. The committee may, in its sole discretion, grant an extension of time to meet the ownership requirements or take such other action as it deems appropriate to enable the executive to achieve compliance with the policy. The table shows the named executive officers’ holdings as of December 31, 2011:2012: | | | | | | | | | | | | | | | | | | Name | | Assigned
Guideline
Multiple of
Base Salary | | Actual
Holdings as a
Multiple of
Base Salary | | Number of
Years at
Guideline
Multiple
(#) | | | Assigned
Guideline
Multiple of
Base Salary | | Actual
Holdings as a
Multiple of
Base Salary | | Number of
Years at
Guideline
Multiple
(#) | | Terry D. Hildestad | | 4X | | 6.13 | | 6.67 | | | 4X | | 6.06 | | 7.67 | | Doran N. Schwartz | | 3X | | 1.47 | | 1.87 | (1) | | 3X | | 1.75 | | 2.87 | (1) | Steven L. Bietz | | | 3X | | 4.09 | | 10.33 | | J. Kent Wells | | 3X | | 0.00 | | 0.67 | (2) | | 3X | | 1.07 | | 1.67 | (2) | John G. Harp | | 3X | | 4.09 | | 7.25 | | | William E. Schneider | | 3X | | 5.57 | | 10.00 | | | 3X | | 4.96 | | 11.00 | |
| | | (1) | Participant must meet ownership requirement by January 1, 2015. | | (2) | As of February 22, 2012, Mr. Wells owns 25,743 shares of our common stock. Participant must meet ownership requirement by May 1, 2016.
| | | | |
| | | | 32
| MDU Resources Group, Inc. Proxy Statement
|
The compensation committee may consider the policy and the executive’s stock ownership in determining compensation. The committee, however, did not do so with respect to 20112012 compensation. Policy Regarding Hedging Stock Ownership
Our executive compensation policy prohibits Section 16 officers from hedging their ownership of company common stock. Executives may not enter into transactions that allow the executive to benefit from devaluation of our stock or otherwise own stock technically but without the full benefits and risks of such ownership. See the Security Ownership section of the proxy statement for our policy on margin accounts and pledging of our stock. Compensation Committee Report The compensation committee has reviewed and discussed the Compensation Discussion and Analysis required by Reg.Regulation S-K, Item 402(b), with management. Based on the review and discussions referred to in the preceding sentence, the compensation committee recommended to the board of directors that the Compensation Discussion and Analysis be included in our proxy statement on Schedule 14A. Thomas Everist, Chairman
Karen B. Fagg
Thomas C. Knudson
Patricia L. Moss | | | | MDU Resources Group, Inc. Proxy Statement | 3329
|
| Proxy Statement | | Summary Compensation Table for 20112012 |
| | | | | | | | | | | | | | | | | | | | | | | | | | | | | | | | | | | | | | | Name and
Principal Position
(a) | | Year
(b) | | Salary
($)
(c) | | Bonus
($)
(d) | | Stock
Awards
($)
(e)(1) | | Option
Awards
($)
(f) | | Non-Equity
Incentive Plan
Compensation
($)
(g) | | Change in
Pension Value
and
Nonqualified
Deferred
Compensation
Earnings
($)
(h)(2) | | All Other
Compensation
($)
(i) | | Total
($)
(j) | | Name and
Principal Position
(a) | Year
(b) | | Salary
($)
(c) | | Bonus
($)
(d) | | Stock
Awards
($)
(e)(1) | | Option
Awards
($)
(f) | | Non-Equity
Incentive Plan
Compensation
($)
(g) | | Change in
Pension Value
and
Nonqualified
Deferred
Compensation
Earnings
($)
(h)(2) | | All Other
Compensation
($)
(i) | | Total
($)
(j) | | | | | Terry D. Hildestad | | 2011 | | 750,000 | | — | | 1,084,318 | | — | | 954,750 | | 739,760 | | 37,499 | (3) | | 3,566,327 | | | 2012 | | 750,000 | | — | | 897,277 | | — | | 518,250 | | 355,027 | | 38,224 | (3) | 2,558,778 | | President and CEO | | 2010 | | 750,000 | | — | | 830,137 | | — | | 762,750 | | 480,532 | | 37,499 | | 2,860,918 | | | 2011 | | 750,000 | | — | | 1,084,318 | | — | | 954,750 | | 739,760 | | 37,499 | | 3,566,327 | | | | 2009 | | 750,000 | | — | | 1,117,861 | | — | | 1,500,000 | | 825,319 | | 9,824 | | 4,203,004 | | | 2010 | | 750,000 | | — | | 830,137 | | — | | 762,750 | | 480,532 | | 37,499 | | 2,860,918 | | | | | | | | | | | | | | | | | | | | | | Doran N. Schwartz | | 2011 | | 273,000 | | — | | 197,341 | | — | | 173,765 | | 147,789 | | 33,549 | (3) | | 825,444 | | | 2012 | | 300,000 | | — | | 179,445 | | — | | 103,650 | | 100,935 | | 34,224 | (3) | 718,254 | | Vice President and CFO | | 2010 | | 252,454 | | — | | 143,881 | | — | | 127,053 | | 71,302 | | 33,549 | | 628,239 | | | 2011 | | 273,000 | | — | | 197,341 | | — | | 173,765 | | 147,789 | | 33,549 | | 825,444 | | | | 2009 | | — | | — | | — | | — | | — | | — | | — | | — | | | 2010 | | 252,454 | | — | | 143,881 | | — | | 127,053 | | 71,302 | | 33,549 | | 628,239 | | | | | | | | | | | | | | | | | | | | | | John G. Harp | | 2011 | | 450,000 | | — | | 390,345 | | — | | 438,750 | | 481,331 | (4) | | 51,445 | (3) | | 1,811,871 | | | President and CEO of | | 2010 | | 450,000 | | — | | 298,845 | | — | | 438,750 | | 307,935 | | 48,545 | (5) | | 1,544,075 | | | MDU Construction | | 2009 | | 450,000 | | — | | 402,417 | | — | | 392,500 | (6) | | 761,670 | | | 23,272 | (5) | | 2,029,859 | | | Services Group, Inc. | | | | | | | | | | | | | | | | | | | | | Steven L. Bietz | | | 2012 | | 360,500 | | — | | 258,765 | | — | | 347,973 | | 329,969 | | 37,884 | (3) | 1,335,091 | | President and CEO | | | 2011 | | 360,500 | | — | | 312,704 | | — | | 229,198 | | 545,066 | | 37,159 | | 1,484,627 | | of WBI Holdings, Inc. | | | 2010 | | 350,000 | | — | | 232,429 | | — | | 245,245 | | 302,863 | | 36,218 | | 1,166,755 | | | | | | | | | | | | | | | | | | | | | | J. Kent Wells | | 2011 | | 367,671 | | 916,685 | (7) | | 925,000 | (8) | | — | | 1,007,306 | (9) | | — | | 89,505 | (3) | | 3,306,167 | | | 2012 | | 550,000 | | — | | 877,331 | | — | | — | | — | | 96,470 | (3) | 1,523,801 | | President and CEO of | | 2010 | | — | | — | | — | | — | | — | | — | | — | | — | | | 2011 | | 367,671 | | 916,685 | (4) | 925,000 | (5) | — | | 1,007,306 | (6) | — | | 84,580 | (7) | 3,301,242 | | Fidelity Exploration & | | 2009 | | — | | — | | — | | — | | — | | — | | — | | — | | | Production Company | | | | | | | | | | | | | | | | | | | | | Fidelity Exploration & Production Company | | | 2010 | | — | | — | | — | | — | | — | | — | | — | | — | | | | | | | | | | | | | | | | | | | | | | William E. Schneider | | 2011 | | 447,400 | | — | | 388,086 | | — | | 436,215 | | 412,085 | | 37,499 | (3) | | 1,721,285 | | | 2012 | | 447,400 | | — | | 321,146 | | — | | 200,950 | | 240,068 | | 38,224 | (3) | 1,247,788 | | President and CEO of | | 2010 | | 447,400 | | — | | 297,122 | | — | | 37,805 | | 306,909 | | 37,499 | | 1,126,735 | | | Knife River Corporation | | 2009 | | 447,400 | | — | | 400,093 | | — | | 581,620 | | 726,646 | | 9,324 | | 2,165,083 | | | Executive Vice President - | | | 2011 | | 447,400 | | — | | 388,086 | | — | | 436,215 | | 412,085 | | 37,499 | | 1,721,285 | | Bakken Development | | | 2010 | | 447,400 | | — | | 297,122 | | — | | 37,805 | | 306,909 | | 37,499 | | 1,126,735 | |
| | | | (1) | Amounts in this column represent the aggregate grant date fair value of the performance share awards calculated in accordance with Financial Accounting Standards Board generally accepted accounting principles for stock-based compensation in FASB Accounting Standards Codification Topic 718. This column was prepared assuming none of the awards will be forfeited. The amounts were calculated using a Monte Carlo simulation, as described in Note 13 of our audited financial statements in our Annual Report on Form 10-K for the year ended December 31, 2011.2012. | | | (2) | Amounts shown represent the change in the actuarial present value for years ended December 31, 2009, 2010, 2011, and 20112012 for the named executive officers’ accumulated benefits under the pension plan, excess SISP, and SISP, and, for Mr. Harp, the additional retirement benefit, collectively referred to as the “accumulated pension change,” plus above market earnings on deferred annual incentives, if any. The amounts shown are based on accumulated pension change and above market earnings as of December 31, 2009, 2010, 2011, and 2011,2012, as follows: |
| | | | | | | | | | | | | | | | | | | | | | | | | | | | | Accumulated
Pension Change | | Above Market
Earnings | | | Accumulated
Pension Change | | Above Market
Earnings | | Name | | 12/31/2009
($) | | 12/31/2010
($) | | 12/31/2011
($) | | 12/31/2009
($) | | 12/31/2010
($) | | 12/31/2011
($) | | | 12/31/2010
($) | | 12/31/2011
($) | | 12/31/2012
($) | | 12/31/2010
($) | | 12/31/2011
($) | | 12/31/2012
($) | | | | | | | | | | | | | | | | | Terry D. Hildestad | | 806,554 | | 462,186 | | 728,587 | | 18,765 | | 18,346 | | 11,173 | | | 462,186 | | 728,587 | | 331,845 | | 18,346 | | 11,173 | | 23,182 | | Doran N. Schwartz | | — | | 71,302 | | 147,789 | | — | | — | | — | | | 71,302 | | 147,789 | | 100,935 | | — | | — | | — | | John G. Harp | | 743,334 | | 294,023 | | 459,963 | | — | | — | | — | | | Additional Retirement (4) | | 18,336 | | 13,912 | | 21,368 | | — | | — | | — | | | Steven L. Bietz | | | 302,863 | | 545,066 | | 329,969 | | — | | — | | — | | J. Kent Wells | | — | | — | | — | | — | | — | | — | | | — | | — | | — | | — | | — | | — | | William E. Schneider | | 696,572 | | 277,507 | | 393,768 | | 30,074 | | 29,402 | | 18,317 | | | 277,507 | | 393,768 | | 201,944 | | 29,402 | | 18,317 | | 38,124 | | | | | | | | | | | | | | | | |
| | | | 3430
| MDU Resources Group, Inc. Proxy Statement |
(3)
| | | | | | | | | | | | | | | | | | | | | | | | | | | | | | | | | | | | | | 401(k)
($)(a) | | | Life
Insurance
Premium
($) | | | Matching
Charitable
Contribution
($) | | | Office and
Automobile
Allowance
($) | | | Additional
LTD
Premium
($) | | | Relocation
($)(b) | | | Parking
($) | | | Payment
In Lieu
of
Medical
Coverage
($) | | | Spousal
Travel
($) | | | Wellness
Fitness
($) | | | Total
($) | | | | Terry D. Hildestad | | | 35,525 | | | 174 | | | 1,800 | | | — | | | — | | | — | | | — | | | — | | | — | | | — | | | 37,499 | | Doran N. Schwartz | | | 33,075 | | | 174 | | | 300 | | | — | | | — | | | — | | | — | | | — | | | — | | | — | | | 33,549 | | John G. Harp | | | 35,525 | | | 174 | | | 1,800 | | | 13,200 | | | 746 | | | — | | | — | | | — | | | — | | | — | | | 51,445 | | J. Kent Wells | | | 19,600 | | | 116 | | | — | | | — | | | — | | | 66,031 | | | 2,400 | | | 700 | | | 508 | | | 150 | | | 89,505 | | William E. Schneider | | | 35,525 | | | 174 | | | 1,800 | | | — | | | — | | | — | | | — | | | — | | | — | | | — | | | 37,499 | |
| | | | | | | | | | | | | | | | | | | | | | 401(k)
($)(a) | | Life
Insurance
Premium
($) | | Matching
Charitable
Contribution
($) | | Additional
LTD
Premium
($) | | Relocation
($) | | Parking
($) | | Payment
In Lieu
of
Medical
Coverage
($) | | Spousal
Travel
($) | | Total
($) | | Terry D. Hildestad | | 36,250 | | 174 | | 1,800 | | — | | — | | — | | — | | — | | 38,224 | | Doran N. Schwartz | | 33,750 | | 174 | | 300 | | — | | — | | — | | — | | — | | 34,224 | | Steven L. Bietz | | 36,250 | | 174 | | 1,460 | | — | | — | | — | | — | | — | | 37,884 | | J. Kent Wells | | 20,000 | | 174 | | — | | 435 | | 69,695 | | 3,600 | | 1,200 | | 1,366 | | 96,470 | | William E. Schneider | | 36,250 | | 174 | | 1,800 | | — | | — | | — | | — | | — | | 38,224 | |
| | | | (a) | Represents company contributions to 401(k) plan, which include matching contributions and except for Mr. Wells, contributions made in lieu of pension plan accruals after pension plans were frozen at December 31, 2009. | (b)
| Mr. Wells’ 2011 relocation benefits were:
|
| | | Temporary | Actual Move and | Relocation | Living | Related Expense | Allowance | ($) | ($) | ($) | 18,000 | 2,198 | 45,833 |
| | (4) | In addition to the change in the actuarial present value of Mr. Harp’s accumulated benefit under the pension plan, excess SISP, and SISP, this amount also includes the following amounts attributable to Mr. Harp’s additional retirement benefit:
|
| | | | | | | | | | | | | | 2009 | | | 2010 | | | 2011 | | | | Change in present value of additional years of service for pension plan | | $ | 13,077 | | $ | 12,240 | | $ | 19,407 | | Change in present value of additional years of service for excess SISP | | | 5,259 | | | 1,672 | | | 1,961 | | Change in present value of additional years of service for SISP | | | — | | | — | | | — | |
Mr. Harp’s additional retirement benefit is described in the narrative that follows the Pension Benefits for 2011 table. The additional retirement benefit provides Mr. Harp with additional retirement benefits equal to the additional benefit he would earn under the pension plan, excess SISP, and the SISP if he had three additional years of service. The pension and excess SISP were frozen as of December 31, 2009. The amounts in the table above reflect the change in present value of this additional benefit in 2009, 2010, and 2011. The additional retirement benefit was determined by calculating the actuarial present values of the accumulated benefits under the pension plan, excess SISP, and SISP, with and without the three additional years of service, using the same assumptions used to determine the amounts disclosed in the Pension Benefits for 2011 table. Because Mr. Harp would be fully vested in his SISP benefit if he retired at age 65, the assumed retirement age of these calculations, the additional years of service provided by the additional retirement agreement would not increase that benefit. If Mr. Harp retires before becoming 100% vested in his SISP benefit, his SISP benefit would be less than the amount shown in the Pension Benefits for 2011 table, but the payments he would receive under the additional retirement benefit arrangement would increase, as would the amounts reflected in the table above and in the Summary Compensation Table.
| | (5)
| Includes company contributions to Mr. Harp’s 401(k) of a company match and retirement contribution, a matching contribution to a charity, payment of a life insurance premium, an additional premium for Mr. Harp’s long-term disability insurance, and Mr. Harp’s office and automobile allowance.
| (6)
| Includes one-time incentive payment of $100,000 in addition to his annual incentive compensation.
| (7)
| Includes a cash recruitment payment of $550,000 and guaranteed target annual incentive payment of $366,685. | (8)
| | (5) | Represents the aggregate grant date fair value of the portion of Mr. Wells’ additional 2011 annual incentive award that was to be paid in shares of our common stock calculated in accordance with Financial Accounting Standards Board generally accepted accounting principles for stock-based compensation in FASB Accounting Standards Codification Topic 718. | (9)
| | (6) | Includes $82,296, the value of Mr. Wells’ annual incentive earned above the guaranteed target amount and the $925,010 cash portion of Mr. Wells’ additional 2011 annual incentive. |
| | | (7) | | MDU Resources Group, Inc. Proxy Statement
| 35
|
| Proxy Statement
The 2011 amount for Mr. Wells’ all other compensation has been reduced to reflect the removal of $4,925, an excess 401(k) company match, that exceeded the limit when contributions from his prior company and current company were aggregated.
|
Grants of Plan-Based Awards in 20112012 | | | | | | | | | | | | | | | | | | | | | | | | | | | | | | | | | | | | | | | | | | | | | | | | | | | | All Other
Stock
Awards:
Number of
Shares of
Stock or
Units
(#)
(i) | | All Other
Option
Awards:
Number of
Securities
Underlying
Options
(#)
(j) | | Exercise
or Base
Price of
Option
Awards
($/Sh)
(k) | | Grant
Date Fair
Value of
Stock and
Option
Awards
($)
(l) | | | | All Other | | All Other | | | | | | | | | | Stock | | Option | | | | Grant | | | | | | | Awards: | | Awards: | | Exercise | | Date Fair | | | | | Estimated Future
Payouts Under Non-Equity
Incentive Plan Awards | | Estimated Future
Payouts Under Equity
Incentive Plan Awards | | | | Estimated Future | | Estimated Future | | Number of | | Number of | | or Base | | Value of | | Name
(a) | | Grant Date
(b) | | Board Approval
Date | | Threshold
($)
(c) | | Target
($)
(d) | | Maximum
($)
(e) | | Threshold
(#)
(f) | | Target
(#)
(g) | | Maximum
(#)
(h) | | | | | | | | Payouts Under Non-Equity | | Payouts Under Equity | | Shares of | | Securities | | Price of | | Stock and | | | | | | Incentive Plan Awards | | Incentive Plan Awards | | Stock or | | Underlying | | Option | | Option | | | | | Grant | | Threshold | | Target | | Maximum | | Threshold | | Target | | Maximum | | Units | | Options | | Awards | | Awards | | Name | | | Date | | ($) | | ($) | | ($) | | (#) | | (#) | | (#) | | (#) | | (#) | | ($/Sh) | | ($) | | (a) | | | (b) | | (c) | | (d) | | (e) | | (f) | | (g) | | (h) | | (i) | | (j) | | (k) | | (l) | | Terry D. | | 2/17/11(1 | ) | | — | | 187,500 | | 750,000 | | 1,500,000 | | — | | — | | — | | — | | — | | — | | — | | | 3/1/2012(1 | ) | 187,500 | | 750,000 | | 1,500,000 | | — | | — | | — | | — | | — | | — | | — | | Hildestad | | 2/17/11(2 | ) | | — | | — | | — | | — | | 5,424 | | 54,243 | | 108,486 | | — | | — | | — | | 1,084,318 | | | 2/16/2012(2 | ) | — | | — | | — | | 5,223 | | 52,228 | | 104,456 | | — | | — | | — | | 897,277 | | Doran N. | | 2/17/11(1 | ) | | — | | 34,125 | | 136,500 | | 273,000 | | — | | — | | — | | — | | — | | — | | — | | | 3/1/2012(1 | ) | 37,500 | | 150,000 | | 300,000 | | — | | — | | — | | — | | — | | — | | — | | Schwartz | | 2/17/11(2 | ) | | — | | — | | — | | — | | 987 | | 9,872 | | 19,744 | | — | | — | | — | | 197,341 | | | 2/16/2012(2 | ) | — | | — | | — | | 1,045 | | 10,445 | | 20,890 | | — | | — | | — | | 179,445 | | John G. | | 2/17/11(1 | ) | | — | | 73,125 | | 292,500 | | 585,000 | | — | | — | | — | | — | | — | | — | | — | | | Harp | | 2/17/11(2 | ) | | — | | — | | — | | — | | 1,953 | | 19,527 | | 39,054 | | — | | — | | — | | 390,345 | | | Steven L. | | | 3/1/2012(1 | ) | 58,581 | | 234,325 | | 468,650 | | — | | — | | — | | — | | — | | — | | — | | Bietz | | | 2/16/2012(2 | ) | — | | — | | — | | 1,506 | | 15,062 | | 30,124 | | — | | — | | — | | 258,765 | | J. Kent Wells | | 2/17/11(3 | ) | | — | | — | | 366,685 | | 733,370 | | — | | — | | — | | — | | — | | — | | — | | | 3/1/2012(1 | ) | 171,875 | | 687,500 | | 1,375,000 | | — | | — | | — | | — | | — | | — | | — | | | | 5/02/11(4 | ) | | 2/17/11 | (4) | | — | | 925,000 | | — | | — | | — | | — | | — | | — | | — | | — | | | | | 5/02/11(4 | ) | | 2/17/11 | (4) | | — | | — | | — | | — | | | $925,000 | (4) | | — | | — | | — | | — | | 925,000 | | | 2/16/2012(2 | ) | — | | — | | — | | 5,107 | | 51,067 | | 102,134 | | — | | — | | — | | 877,331 | | William E. | | 2/17/11(1 | ) | | — | | 72,703 | | 290,810 | | 581,620 | | — | | — | | — | | — | | — | | — | | — | | | 3/1/2012(1 | ) | 72,703 | | 290,810 | | 581,620 | | — | | — | | — | | — | | — | | — | | — | | Schneider | | 2/17/11(2 | ) | | — | | — | | — | | — | | 1,941 | | 19,414 | | 38,828 | | — | | — | | — | | 388,086 | | | 2/16/2012(2 | ) | — | | — | | — | | 1,869 | | 18,693 | | 37,386 | | — | | — | | — | | 321,146 | |
| | (1) | Annual incentive for 20112012 granted pursuant to the MDU Resources Group, Inc. Long-Term Performance-Based Incentive Plan, except for Mr. Schwartz whose award was granted pursuant to the MDU Resources Group, Inc. Executive Incentive Compensation Plan. | | (2) | Performance shares for the 2011-20132012-2014 performance period granted pursuant to the MDU Resources Group, Inc. Long-Term Performance-Based Incentive Plan. | | (3)
| Annual incentive for 2011 granted pursuant to the WBI Holdings, Inc. Executive Incentive Compensation Plan. Mr. Wells was guaranteed a minimum payment of 100% of target.
| | (4)
| Additional 2011 annual incentive granted pursuant to the MDU Resources Group, Inc. Long-Term Performance-Based Incentive Plan, payable one-half in cash and one-half in our common stock. The award was approved on February 17, 2011, but the grant date for purposes of FASB Accounting Standards Codification Topic 718 was May 2, 2011, Mr. Wells’ hire date. The $925,000 shown in column (g) represents the dollar value of the portion of Mr. Wells’ additional 2011 annual incentive award that was paid in shares of our common stock determined by dividing $925,000 by the stock price on January 2, 2012, according to the terms of Mr. Wells’ award.
| |
Narrative Discussion Relating to the Summary Compensation Table
and Grants of Plan-Based Awards Table Incentive Awards Annual Incentive
On February 15, 2011,March 1, 2012, the compensation committee recommended the 20112012 annual incentive award opportunities for our named executive officers and the board approved these opportunities at its meeting on February 17, 2011.March 1, 2012. These award opportunities are reflected in the Grants of Plan-Based Awards table at grant on February 17, 2011,March 1, 2012, in columns (c), (d), and (e) and in the Summary Compensation Table as earned with respect to 20112012 in column (g). For Mr. Wells, the compensation committee guaranteed a minimum payment of 100% of target, prorated to reflect his May 2, 2011 hire date, which is reflected in the Grants of Plan-Based Awards table at grant on February 17, 2011, in column (d) and in the Summary Compensation Table in column (d). Mr. Wells could achieve a maximum of 200% of target, which is reflected at grant on February 17, 2011, in the Grants of Plan-Based Awards table in column (e), and the amount that he earned above target with respect to this award is reflected in the Summary Compensation Table in column (g). | | | | MDU Resources Group, Inc. Proxy Statement | 31 |
Other than the arrangements negotiated for Mr. Wells for 2011, executive
Executive officers may receive a payment of annual cash incentive awards based upon achievement of annual performance measures with a threshold, target, and maximum level. A target incentive award is established based on a percent of the executive’s base salary. Actual payment may range from 0% to 200% of the target based upon achievement of goals. In order to be eligible to receive a payment of an annual incentive award under the Long-Term Performance-Based Incentive Plan, Messrs. Hildestad, Harp,Bietz, Wells, and Schneider must have remained employed by the company through December 31, 2011,2012, unless the compensation committee determines otherwise. The committee has full discretion to determine the extent to which goals have been achieved, the payment level, whether any final payment will be made, and whether to adjust awards downward based upon individual performance. Unless otherwise determined and established in writing by the compensation committee within 90 days of the beginning of the performance period, the performance goals may not be adjusted if the adjustment would increase the annual incentive award payment. The compensation committee may use negative discretion and adjust any annual incentive award payment downward, using | | | | 36
| MDU Resources Group, Inc. Proxy Statement
|
any subjective or objective measures as it shall determine, including but not limited to the 20% limitation described in the following sentence. The 20% limitation means that no more than 20% of after-tax earnings that are in excess of planned earnings at the business unitsegment level for operating company executives and at the MDU Resources Group level for corporate executives will be paid in annual incentives to executives. The application of this limitation or any other reduction, and the methodology used in determining any such reduction, is in the sole discretion of the compensation committee. With respect to annual incentive awards granted pursuant to the MDU Resources Group, Inc. Executive Incentive Compensation Plan, which includes Mr. Schwartz, and the annual incentive awards granted pursuant to the WBI Holdings, Inc. Executive Incentive Compensation Plan, which includes Mr. Wells, participants who retire at age 65 during the year remain eligible to receive an award. Subject to the compensation committee’s discretion, executives who terminate employment for other reasons are not eligible for an award. The compensation committee has full discretion to determine the extent to which goals have been achieved, the payment level, and whether any final payment will be made. Once performance goals are approved by the committee for executive incentive compensation plan awards, the committee generally does not modify the goals. However, if major unforeseen changes in economic and environmental conditions or other significant factors beyond the control of management substantially affected management’s ability to achieve the specified performance goals, the committee, in consultation with the chief executive officer, may modify the performance goals. Such goal modifications will only be considered in years of unusually adverse or favorable external conditions. Messrs. Harp’s and Schneider’s performance goals for 2011 are budgeted earnings per share achieved and budgeted return on invested capital achieved, each weighted 50%. The goals are measured at the business unit level, as allocated, for Mr. Harp and Mr. Schneider.
For Messrs. Harp and Schneider, achievement of budgeted earnings per share and return on invested capital would result in payment of 100% of the target amount. Their 2011 award opportunities ranged from no payment if the allocated earnings per share and return on invested capital were below the 85% level to a 200% payout for achievement of 115% of budgeted earnings per share and a return on invested capital equal to or greater than the business unit’s weighted average cost of capital would result in payment of 200% of the target amount.
For Mr. Wells, the committee guaranteed a minimum payment of 100% of target, prorated to reflect his May 2, 2011 hire date. The 2011 incentive award opportunity was based on the financial goals for both Fidelity Exploration & Production Company and WBI Holdings, Inc., weighted 75% for the results of Fidelity Exploration & Production Company and 25% for the results of WBI Holdings, Inc. The incentive award could be reduced by up to 10% if Fidelity Exploration & Production Company did not meet its production goal and by up to 5% if WBI Holdings, Inc. did not satisfy its safety goals. Mr. Wells could achieve a maximum of 200% of the annual incentive target if:
| | •
| the 2011 allocated earnings per share for Fidelity Exploration & Production Company and the 2011 allocated earnings per share for WBI Holdings, Inc., were at or above 115% of the performance target
| | | •
| the 2011 return on invested capital for Fidelity Exploration & Production Company and the 2011 return on invested capital for WBI Holdings, Inc. were both at least equal to their respective weighted average costs of capital
| | | •
| Fidelity Exploration & Production Company achieved production of at least 69.3 billion cubic feet equivalent (Bcfe) and
| | | •
| the five safety goals for WBI Holdings, Inc. were met.
|
Annual incentive award payments for Messrs. Hildestad, Schwartz, and SchwartzSchneider were determined based on achievement of performance goals at the annual incentive award payments made to the presidentfollowing business segments – (i) construction services and chief executive officers of the four business units – MDU Construction Services Group, Inc., Knife River Corporation, WBI Holdings, Inc.,construction materials and Combined Utility Group –contracting, (ii) exploration and production, (iii) pipeline and energy services, and (iv) electric and natural gas distribution - and were calculated as follows: each business unit president and chief executive officer’s annual incentive
| | | | | | | | | | | | | Column A
Percentage of
Annual Incentive
Target Achieved | | Column B
Percentage of
Average Invested
Capital | | Column A x Column B | | Construction Services Segment and
Construction Materials and Contracting Segment | | 133.5 | % | | 29.2 | % | | 39.0 | % | | Exploration and Production Segment | | 0.0 | % | | 28.1 | % | | 0.0 | % | | Pipeline and Energy Services Segment | | 148.5 | % | | 8.8 | % | | 13.1 | % | | Electric and Natural Gas Distribution Segments | | 50.0 | % | | 33.9 | % | | 17.0 | % | | Total (Payout Percentage) | | | | | | | | 69.1 | % | |
The award payment, expressed as a percentage of his annual target award, was multiplied by that business unit’s percentage share of average invested capital for 2011. These four products were added together, and the sum was multiplied by Messrs. Hildestad’s and Schwartz’s 2011 target incentive. Messrs. Hildestad’s and Schwartz’s 2011 annual incentives were paid at 127.3% of target based on the following:opportunity available to Mr. Bietz was: | | | | | | | | | | | President and
Chief Executive Officer of: | | Column A
2011 Payment as a
Percentage of Annual
Incentive Target | | Column B
Percentage of
Average Invested
Capital | | Column A x Column B | | MDU Construction Services Group, Inc. | | 150.0 | % | | 6.1 | % | | 9.2 | % | | Knife River Corporation | | 150.0 | % | | 24.4 | % | | 36.6 | % | | WBI Holdings, Inc. | | 97.8 | % | | 34.6 | % | | 33.8 | % | | Combined Utility Group | | 136.7 | % | | 34.9 | % | | 47.7 | % | | Total | | | | | | | | 127.3 | % | |
| | | | | | | | | | | | | Pipeline and Energy Services’ 2012
return on invested capital results
as a % (weighted 37.5%)
of 2012 target | | Corresponding payment of
annual incentive target based on
return on invested capital | | Pipeline and Energy Services’ 2012
earnings per share results
as a % (weighted 37.5%)
of 2012 target | | Corresponding payment of
annual incentive target based on
earnings per share | | | Less than 85% | | 0% | | Less than 85% | | 0% | | | 85% | | 25% | | 85% | | 25% | | | 90% | | 50% | | 90% | | 50% | | | 95% | | 75% | | 95% | | 75% | | | 100% | | 100% | | 100% | | 100% | | | 103% | | 120% | | 103% | | 120% | | | 106% | | 140% | | 106% | | 140% | | | 109% | | 160% | | 109% | | 160% | | | 112% | | 180% | | 112% | | 180% | | | 115% | | 200% | | 115% | | 200% | |
| | | | 32 | MDU Resources Group, Inc.Proxy Statement | 37
|
| | | | | | MDU Resources Group, Inc.’s
consolidated 2012 earnings per share
results (weighted 25%) | | Corresponding payment of
annual incentive target based on
consolidated earnings per share results | | Less than 100% | | 0 | % | | 100 | % | | 100 | % | | 103 | % | | 120 | % | | 106 | % | | 140 | % | | 109 | % | | 160 | % | | 112 | % | | 180 | % | | 115 | % | | 200 | % | |
The award opportunities available to Messrs. Harp and Schneider were: | | | | | | | | 2011 return on invested capital
results as a % of 2011 target | | Corresponding payment of
annual incentive target based on
return on invested capital | | 2011 earnings per share
results as a % of 2011 target | | Corresponding payment of
annual incentive target based on
earnings per share | Less than 85% | | 0% | | Less than 85% | | 0% | 85% | | 25% | | 85% | | 25% | 90% | | 50% | | 90% | | 50% | 95% | | 75% | | 95% | | 75% | 100% | | 100% | | 100% | | 100% | 103% | | 100% | | 103% | | 120% | 106% | | 100% | | 106% | | 140% | 109% | | 100% | | 109% | | 160% | 112% | | 100% | | 112% | | 180% | Up to weighted | | | | 115% | | 200% | average cost of capital | | 100% | | | | | Weighted average cost | | | | | | | of capital or higher | | 200% | | | | |
The award opportunitiesopportunity available to Mr. Wells with respect to the financial results component of his award were:was:
Fidelity Exploration & Production Company – weighted 75%
| | | | | | | | 2011 return on invested capital
results as a % of 2011 target | | Corresponding payment of
annual incentive target based on
return on invested capital | | 2011 earnings per share
results as a % of 2011 target | | Corresponding payment of
annual incentive target based on
earnings per share | Less than 85% | | 0% | | Less than 85% | | 0% | 85% | | 25% | | 85% | | 25% | 90% | | 50% | | 90% | | 50% | 95% | | 75% | | 95% | | 75% | 100% | | 100% | | 100% | | 100% | 103% | | 100% | | 103% | | 120% | 106% | | 100% | | 106% | | 140% | 109% | | 100% | | 109% | | 160% | 112% | | 100% | | 112% | | 180% | Up to weighted | | | | 115% | | 200% | average cost of capital | | 100% | | | | | Weighted average cost | | | | | | | of capital or higher | | 200% | | | | |
WBI Holdings, Inc. – weighted 25%
| | | | | | | | 2011 return on invested capital
results as a % of 2011 target | | Corresponding payment of
annual incentive target based on
return on invested capital | | 2011 earnings per share
results as a % of 2011 target | | Corresponding payment of
annual incentive target based on
earnings per share | Less than 85% | | 0% | | Less than 85% | | 0% | 85% | | 25% | | 85% | | 25% | 90% | | 50% | | 90% | | 50% | 95% | | 75% | | 95% | | 75% | 100% | | 100% | | 100% | | 100% | 103% | | 100% | | 103% | | 120% | 106% | | 100% | | 106% | | 140% | 109% | | 100% | | 109% | | 160% | 112% | | 100% | | 112% | | 180% | Up to weighted | | | | 115% | | 200% | average cost of capital | | 100% | | | | | Weighted average cost | | | | | | | of capital or higher | | 200% | | | | |
| | | | | | | | | | | | Exploration and Production’s 2012
return on invested capital results
as a % (weighted 37.5%)
of 2012 target | | Corresponding payment of
annual incentive target based on
return on invested capital | | Exploration and Production’s 2012
earnings per share results
as a % (weighted 37.5%)
of 2012 target | | Corresponding payment of
annual incentive target based on
earnings per share | | Less than 85% | | 0 | % | | Less than 85% | | 0 | % | | 85 | % | | 25 | % | | 85 | % | | 25 | % | | 90 | % | | 50 | % | | 90 | % | | 50 | % | | 95 | % | | 75 | % | | 95 | % | | 75 | % | | 100 | % | | 100 | % | | 100 | % | | 100 | % | | 108 | % | | 120 | % | | 103 | % | | 120 | % | | 116 | % | | 140 | % | | 106 | % | | 140 | % | | 124 | % | | 160 | % | | 109 | % | | 160 | % | | 132 | % | | 180 | % | | 112 | % | | 180 | % | | 140 | % | | 200 | % | | 115 | % | | 200 | % | |
| | | | | | MDU Resources Group, Inc.’s
consolidated 2012 earnings per share
results (weighted 25%)
| | Corresponding payment of
annual incentive target based on
consolidated earnings per share results
| | Less than 100% | | 0 | % | | 100 | % | | 100 | % | | 103 | % | | 120 | % | | 106 | % | | 140 | % | | 109 | % | | 160 | % | | 112 | % | | 180 | % | | 115 | % | | 200 | % | |
For discussion of the specific incentive plan performance targets and results, please see the Compensation Discussion and Analysis. | | | | 38
| MDU Resources Group, Inc.Proxy Statement
|
Long-Term Incentive
| J. Kent Wells’ Additional 2011 Annual Incentive
| On February 15, 2011, the compensation committee recommended the grant of a second 2011 annual incentive award opportunity to Mr. Wells pursuant to the Long-Term Performance-Based Incentive Plan, based on Fidelity Exploration & Production Company’s cash flow from operations. The board approved this opportunity at its meeting on February 17, 2011. Specifically, we granted Mr. Wells an all-or-nothing award opportunity of $1.85 million, payable one-half in cash and one-half in our common stock, if Fidelity Exploration & Production Company’s 2011 cash flow from operations exceeded $132.0 million and he did not resign from the company prior to January 2, 2012. If Fidelity Exploration & Production Company’s 2011 cash flow from operations exceeded $132.0 million and Mr. Wells’ employment was terminated prior to January 2, 2012, due to a change in control of the company, Mr. Wells would have been entitled to full payment of this incentive award.
|
Fidelity Exploration & Production Company’s actual 2011 cash flow from operations exceeded $132.0 million, resultingOn February 14, 2012, the compensation committee recommended long-term incentive grants to the named executive officers in a paymentthe form of $1.85 million to Mr. Wells. The cash portion paid to Mr. Wells is reportedperformance shares, and the board approved these grants at its meeting on February 16, 2012. These grants are reflected in columns (f), (g), (h), and (l) of the Grants of Plan-Based Awards table and in column (e) of the Summary Compensation Table in column (g), and the grant date fair value of the stock portion of the award is reported in the Summary Compensation Table in column (e).
| J. Kent Wells’ Recruitment BonusTable.
| We paid a cash recruitment bonus of $550,000 to induce Mr. Wells to join the company, which is reflected in the Summary Compensation Table in column (d).
|
| Long-Term Incentive
| On February 15, 2011, the compensation committee recommended long-term incentive grants to the named executive officers in the form of performance shares, and the board approved these grants at its meeting on February 17, 2011. These grants are reflected in columns (f), (g), (h), and (i) of the Grants of Plan-Based Awards table and in column (e) of the Summary Compensation Table.
|
If the company’s 2011-20132012-2014 total shareholder return is positive, from 0% to 200% of the target grant will be paid out in February 2014,2015, depending on our 2011-20132012-2014 total stockholder return compared to the total three-year stockholder returns of companies in our performance graph peer group. The payout percentage is determined as follows: | | | | | The Company’s Percentile Rank | | Payout Percentage of
February 17, 201116, 2012 Grant | | 90th or higher | | 200 | % | | 70th | | 150 | % | | 50th | | 100 | % | | 40th | | 10 | % | | Less than 40th | | 0 | % | |
Payouts for percentile ranks falling between the intervals will be interpolated. We also will pay dividend equivalents in cash on the number of shares actually earned for the performance period. The dividend equivalents will be paid in 20142015 at the same time as the performance awards are paid. If the common stock of a company in the peer group ceases to be traded at any time during the 2012-2014 performance period, the company will be deleted from the peer group. Percentile rank will be calculated without regard to the return of the deleted company. If MDU Resources Group, Inc. or a company in the peer group spins off a segment of its business, the shares of the spun-off entity will be treated as a cash dividend that is reinvested in MDU Resources Group, Inc. or the company in the peer group. | | | | MDU Resources Group, Inc. Proxy Statement | 33 |
If the company’s 2011-20132012-2014 total shareholder return is negative, the number of shares otherwise earned, if any, for the performance period will be reduced in accordance with the following table: | | | | | TSR | | Reduction in Award | | 0% through -5% | | 50 | % | | -5.01% through -10% | | 60 | % | | -10.01% through -15% | | 70 | % | | -15.01% through -20% | | 80 | % | | -20.01% through -25% | | 90 | % | | -25.01% or below | | 100 | % | |
| | | | MDU Resources Group, Inc.Proxy Statement
| 39
|
| Salary and Bonus in Proportion to Total Compensation
| The following table shows the proportion of salary and bonus to total compensation.
|
| | | | | | | | | | | | | | Name | | Salary
($) | | Bonus
($) | | Total
Compensation
($) | | Salary and Bonus
as a % of
Total Compensation | | Terry D. Hildestad | | | 750,000 | | | — | | | 3,566,327 | | | 21.0 | | Doran N. Schwartz | | | 273,000 | | | — | | | 825,444 | | | 33.1 | | John G. Harp | | | 450,000 | | | — | | | 1,811,871 | | | 24.8 | | J. Kent Wells | | | 367,671 | | | 916,685 | | | 3,306,167 | | | 38.8 | | William E. Schneider | | | 447,400 | | | — | | | 1,721,285 | | | 26.0 | |
Salary and Bonus in Proportion to Total Compensation
The following table shows the proportion of salary and bonus to total compensation: | | | | | | | | | | | | | | Name | | Salary
($) | | Bonus
($) | | Total
Compensation
($) | | Salary and Bonus
as a % of
Total Compensation | Terry D. Hildestad | | | 750,000 | | | — | | | 2,558,778 | | | 29.3 | % | Doran N. Schwartz | | | 300,000 | | | — | | | 718,254 | | | 41.8 | % | Steven L. Bietz | | | 360,500 | | | — | | | 1,335,091 | | | 27.0 | % | J. Kent Wells | | | 550,000 | | | — | | | 1,523,801 | | | 36.1 | % | William E. Schneider | | | 447,400 | | | — | | | 1,247,788 | | | 35.9 | % |
Outstanding Equity Awards at Fiscal Year-End 20112012 | | | | | | | | | | | | | | | | | | | | | | | | | | | | | | | | | | | | | | | | | | | | | | | | Option Awards | | Stock Awards | | | Option Awards | | Stock Awards | | Name
(a) | | Number of
Securities
Underlying
Unexercised
Options
Exercisable
(#)
(b) | | Number of
Securities
Underlying
Unexercised
Options
Unexercisable
(#)
(c) | | Equity
Incentive
Plan Awards:
Number of
Securities
Underlying
Unexercised
Unearned
Options
(#)
(d) | | Option
Exercise
Price
($)
(e) | | Option
Expiration
Date
(f) | | Number
of Shares
or Units
of Stock
That
Have Not
Vested
(#)
(g) | | Market
Value of
Shares or
Units of
Stock
That
Have Not
Vested
($)
(h) | | Equity
Incentive
Plan Awards:
Number of
Unearned
Shares,
Units or
Other Rights
That Have
Not Vested
(#)
(i) | | Equity
Incentive
Plan Awards:
Market or
Payout Value
of Unearned
Shares,
Units or
Other Rights
That Have
Not Vested
($)
(j)(1) | | | Number of
Securities
Underlying
Unexercised
Options
Exercisable
(#)
(b) | | Number of
Securities
Underlying
Unexercised
Options
Unexercisable
(#)
(c) | | Equity
Incentive
Plan Awards:
Number of
Securities
Underlying
Unexercised
Unearned
Options
(#)
(d) | | Option
Exercise
Price
($)
(e) | | Option
Expiration
Date
(f) | | Number
of Shares
or Units
of Stock
That
Have Not
Vested
(#)
(g) | | Market
Value of
Shares or
Units of
Stock
That
Have Not
Vested
($)
(h) | | Equity
Incentive
Plan Awards:
Number of
Unearned
Shares,
Units or
Other Rights
That Have
Not Vested
(#)
(i) | | Equity
Incentive
Plan Awards:
Market or
Payout Value
of Unearned
Shares,
Units or
Other Rights
That Have
Not Vested
($)
(j)(1) | | Terry D. Hildestad | | — | | — | | — | | — | | — | | — | | — | | 118,739(2 | ) | | 2,548,139 | | | — | | — | | — | | — | | — | | — | | — | | 111,242(2 | ) | | 2,362,780 | | Doran N. Schwartz | | — | | — | | — | | — | | — | | — | | — | | 21,062(2 | ) | | 451,991 | | | — | | — | | — | | — | | — | | — | | — | | 21,144(2 | ) | | 449,099 | | John G. Harp | | — | | — | | — | | — | | — | | — | | — | | 42,746(2 | ) | | 917,329 | | | Steven L. Bietz | | | — | | — | | — | | — | | — | | — | | — | | 32,041(2 | ) | | 680,551 | | J. Kent Wells | | — | | — | | — | | — | | — | | — | | — | | 43,103(3 | ) | | 925,000 | | | — | | — | | — | | — | | — | | — | | — | | 51,067(2 | ) | | 1,084,663 | | William E. Schneider | | — | | — | | — | | — | | — | | — | | — | | 42,498(2 | ) | | 912,007 | | | — | | — | | — | | — | | — | | — | | — | | 39,815(2 | ) | | 845,671 | |
| | (1) | Value based on the number of performance shares reflected in column (i) multiplied by $21.46,$21.24, the year-end closing price for 2011.2012. | | | (2) | Below is a breakdown by year of the plan awards: |
| | | | | | | | | | | | | | | | | Named Executive Officer | | Award | | Shares | | End of
Performance
Period | | Award | | Shares | | End of
Performance
Period | | Terry D. Hildestad | | 2009 | | 5,482 | | 12/31/11 | | Terry D. Hildestad | | | 2010 | | 4,771 | | 12/31/12 | | | | 2010 | | 4,771 | | 12/31/12 | | 2011 | | 54,243 | | 12/31/13 | | | | 2011 | | 108,486 | | 12/31/13 | | 2012 | | 52,228 | | 12/31/14 | | Doran N. Schwartz | | 2009 | | 491 | | 12/31/11 | | 2010 | | 827 | | 12/31/12 | | | | 2010 | | 827 | | 12/31/12 | | 2011 | | 9,872 | | 12/31/13 | | | | 2011 | | 19,744 | | 12/31/13 | | 2012 | | 10,445 | | 12/31/14 | | John G. Harp | | 2009 | | 1,974 | | 12/31/11 | | Steven L. Bietz | | | 2010 | | 1,336 | | 12/31/12 | | | | | 2011 | | 15,643 | | 12/31/13 | | | | | 2012 | | 15,062 | | 12/31/14 | | J. Kent Wells | | | 2010 | | — | | 12/31/12 | | | | 2010 | | 1,718 | | 12/31/12 | | 2011 | | — | | 12/31/13 | | | | 2011 | | 39,054 | | 12/31/13 | | 2012 | | 51,067 | | 12/31/14 | | William E. Schneider | | 2009 | | 1,962 | | 12/31/11 | | 2010 | | 1,708 | | 12/31/12 | | | | 2010 | | 1,708 | | 12/31/12 | | 2011 | | 19,414 | | 12/31/13 | | | | 2011 | | 38,828 | | 12/31/13 | | 2012 | | 18,693 | | 12/31/14 | |
| | | Shares for the 2009 award are shown at the threshold level (10%) based on results for the 2009-2011 performance cycle below threshold.
| | Shares for the 2010 award are shown at the threshold level (10%) based on results for the first two years of the 2010-2012 performance cycle below threshold. | | Shares for the 2011 award are shown at the maximumtarget level (200%(100%) based on results for the first two years of the 2011-2013 performance cycle below target. | | Shares for the 2012 award are shown at the target level (100%) based on results for the first year of the 2011-20132012-2014 performance cycle abovebelow target. | | | (3)
| The number of shares for the additional 2011 annual incentive equity award of $925,000 was determined by using the year-end closing price for 2011 of $21.46. These shares vested February 16, 2012.
|
| | | | 4034
| MDU Resources Group, Inc.Proxy Statement |
Option Exercises and Stock Vested During 2012 | | | | | | | | | | | | | | | | Option Awards | | Stock Awards | | Name
(a) | | Number of Shares Acquired
on Exercise
(#)
(b) | | Value Realized
on Exercise
($)
(c) | | Number of Shares Acquired
on Vesting
(#)
(d)(1) | | Value Realized
on Vesting
($)
(e)(2) | | Terry D. Hildestad | | | — | | | — | | | — | | | — | | Doran N. Schwartz | | | — | | | — | | | — | | | — | | Steven L. Bietz | | | — | | | — | | | — | | | — | | J. Kent Wells | | | — | | | — | | | 43,103 | | | 934,042 | | William E. Schneider | | | — | | | — | | | — | | | — | |
| | (1) | Reflects the portion of Mr. Wells’ additional 2011 annual incentive award that vested on February 16, 2012 and was paid in shares of our common stock determined by dividing $925,000 by the stock price on December 30, 2011, according to the terms of Mr. Wells’ award. | | | (2) | Reflects the value of the portion of Mr. Wells’ additional 2011 annual incentive award that was paid in shares of our common stock based on our closing stock price of $21.67 on February 16, 2012. |
Pension Benefits for 20112012 | | | | | | | | | | | | | | | | | | | Name
(a) | | Plan Name
(b) | | Number of
Years Credited
Service
(#)
(c) | | Present Value
of Accumulated
Benefit
($)
(d) | | Payments
During Last
Fiscal Year
($)
(e) | | | Plan Name
(b) | | Number of
Years Credited
Service
(#)
(c) | | Present Value
of Accumulated
Benefit
($)
(d) | | Payments
During Last
Fiscal Year
($)
(e) | | Terry D. Hildestad | | MDU Pension Plan | | 35 | | 1,619,835 | | — | | | MDU Pension Plan | | 35 | | 1,662,318 | | — | | | | SISP I(1)(3) | | 10 | | 1,951,968 | | — | | | SISP I(1)(3) | | 10 | | 2,126,747 | | — | | | | SISP II(2)(3) | | 10 | | 3,222,988 | | — | | | SISP II(2)(3) | | 10 | | 3,511,576 | | — | | | | SISP Excess(4) | | 35 | | 552,948 | | — | | | SISP Excess(4) | | 35 | | 378,943 | | — | | Doran N. Schwartz | | MDU Pension Plan | | 4 | | 78,419 | | — | | | MDU Pension Plan | | 4 | | 94,002 | | — | | | | SISP II(2)(3) | | 4 | | 403,676 | | — | | | SISP II(2)(3) | | 5 | | 489,028 | | — | | John G. Harp | | MDU Pension Plan | | 5 | | 242,675 | | — | | | Steven L. Bietz | | | WBI Pension Plan | | 28 | | 1,154,443 | | — | | | | SISP II(2)(3) | | 6 | | 2,461,293 | | — | | | SISP I(1)(3) | | 10 | | 799,197 | | — | | | | SISP Excess(4) | | 5 | | 40,291 | | — | | | SISP II(2)(3) | | 10 | | 768,065 | | — | | | | Harp Additional Retirement Benefit | | 3 | | 155,416 | | — | | | SISP Excess(4) | | 28 | | 103,162 | | — | | J. Kent Wells(5) | | — | | — | | — | | — | | | — | | — | | — | | — | | William E. Schneider | | KR Pension Plan | | 16 | | 786,231 | | — | | | KR Pension Plan | | 16 | | 800,720 | | — | | | | SISP I(1)(3) | | 10 | | 1,372,770 | | — | | | SISP I(1)(3) | | 10 | | 1,479,910 | | — | | | | SISP II(2)(3) | | 10 | | 1,621,769 | | — | | | SISP II(2)(3) | | 10 | | 1,748,343 | | — | | | | SISP Excess(4) | | 16 | | 46,259 | | — | | |
| | (1) | Grandfathered under Section 409A. | (2) | Not grandfathered under Section 409A. | (3) | Years of credited service only affects vesting under SISP I and SISP II. The number of years of credited service in the table reflects the years of vesting service completed in SISP I and SISP II as of December 31, 2011,2012, rather than total years of service with the company. Ten years of vesting service is required to obtain the full benefit under these plans. The present value of accumulated benefits was calculated by assuming the named executive officer would have ten years of vesting service on the assumed benefit commencement date; therefore, no reduction was made to reflect actual vesting levels. | (4) | The number of years of credited service under the SISP excess reflects the years of credited benefit service in the appropriate pension plan as of December 31, 2009, when the pension plans were frozen, rather than the years of participation in the SISP excess. We reflect years of credited benefit service in the appropriate pension plan because the SISP excess provides a benefit that is based on benefits that would have been payable under the pension plans absent Internal Revenue Code limitations. | (5) | Mr. Wells is not eligible to participate in our pension plan and does not participate in the SISP. |
The amounts shown for the pension plan and SISP excess represent the actuarial present values of the executives’ accumulated benefits accrued as of December 31, 2011,2012, calculated using a 4.00%3.45%, 4.11%3.59%, 3.76%, and 4.07%3.58% discount rate for the SISP excess, MDU pension plan, WBI pension plan, and KR pension plan, respectively, the 20122013 IRS Static Mortality Table for post-retirement mortality, and no recognition of future salary increases or pre-retirement mortality. The assumed retirement ages for these benefits was age 60 for Messrs. Schwartz and Harp.Bietz. This is the earliest age at which the executives could begin receiving unreduced benefits. Retirement on December 31, 2011,2012, was assumed for Messrs. Hildestad and Schneider, who were age 6263 and 63,64, respectively, on that date. The amounts shown for the SISP I and SISP II were determined using a 4.00%3.45% discount rate and assume benefits commenced at age 65. The assumptions used to calculate Mr. Harp’s additional retirement benefit are described below. | | | | MDU Resources Group, Inc. Proxy Statement | 35 |
| Pension Plans | Messrs. Hildestad Schwartz, and HarpSchwartz participate in the MDU Resources Group, Inc. Pension Plan for Non-Bargaining Unit Employees, which we refer to as the MDU pension plan. Mr. Bietz participates in the Williston Basin Interstate Pipeline Company Pension Plan, which we refer to as the WBI pension plan. Mr. Schneider participates in the Knife River Corporation Salaried Employees’ Pension Plan, which we refer to as the KR pension plan. Pension benefits under the pension plans are based on the participant’s average annual salary over the 60 consecutive month period in which the participant received the highest annual salary during the participant’s final 10 years of service. For this purpose, only a participant’s salary is considered; incentives and other forms of compensation are not included. Benefits are determined by multiplying (1) the participant’s years of credited service by (2) the sum of (a) the average annual salary up to the social security integration level times 1.1% and (b) the average annual salary over the social security integration level times 1.45%. The KR pension plan uses the same formula except that 1.2% and 1.6% are used instead of 1.1% and 1.45%. The maximum years of service recognized when determining benefits under the pension plans is 35. Pension plan benefits are not reduced for social security benefits. |
Each of the pension plans was amended to cease benefit accruals as of December 31, 2009, meaning the normal retirement benefit will not change. The years of credited service in the table reflect the named executive officers’ years of credited service as of December 31, 2009. | | | | MDU Resources Group, Inc.Proxy Statement
| 41
|
To receive unreduced retirement benefits under the MDU pension plan and the WBI pension plan, participants must either remain employed until age 60 or elect to defer commencement of benefits until age 60. Under the KR pension plan, participants must remain employed until age 62 or elect to defer commencement of benefits until age 62 to receive unreduced benefits. Messrs.Mr. Hildestad and Schneider werewas eligible for unreduced retirement benefits under the MDU pension plan, and Mr. Schneider was eligible for unreduced retirement benefits under the KR pension plan respectively, on December 31, 2011.2012. Participants whose employment terminates between the ages of 55 and 60, with 5 years of service under the MDU pension plan and the WBI pension plan are eligible for early retirement benefits. Early retirement benefits are determined by reducing the normal retirement benefit by 0.25% per month for each month before age 60 in the MDU pension plan and the WBI pension plan. If a participant’s employment terminates before age 55, the same reduction applies for each month the termination occurs before age 62, with the reduction capped at 21%. Mr. Harp is currently eligible for early retirement benefits. Benefits for single participants under the pension plans are paid as straight life annuities and benefits for married participants are paid as actuarially reduced annuities with a survivor benefit for spouses, unless participants choose otherwise. Participants hired before January 1, 2004, who terminate employment before age 55 may elect to receive their benefits in a lump sum. Mr. Bietz would have been eligible for a lump sum if he had retired on December 31, 2012. The Internal Revenue Code limits the amounts that may be paid under the pension plans and the amount of compensation that may be recognized when determining benefits. In 2009 when the pension plans were frozen, the maximum annual benefit payable under the pension plans was $195,000 and the maximum amount of compensation that could be recognized when determining benefits was $245,000. | Supplemental Income Security Plan
We also offer key managers and executives, including our named executive officers, except Mr. Wells, benefits under our nonqualified retirement plan, which we refer to as the Supplemental Income Security Plan or SISP. Benefits under the SISP consist of: | We also offer key managers and executives, including our named executive officers, except Mr. Wells, benefits under our nonqualified retirement plan, which we refer to as the Supplemental Income Security Plan or SISP. Benefits under the SISP consist of: |
| | • | a supplemental retirement benefit intended to augment the retirement income provided under the pension plans – we refer to this benefit as the regular SISP benefit | | | • | an excess retirement benefit relating to Internal Revenue Code limitations on retirement benefits provided under the pension plans –we– we refer to this benefit as the SISP excess benefit, and | | | • | death benefits – we refer to these benefits as the SISP death benefit. |
SISP benefits are forfeited if the participant’s employment is terminated for cause. Regular SISP Benefits and Death Benefits
Regular SISP benefits and death benefits are determined by reference to one of two schedules attached to the SISP – the original schedule or the amended schedule. Our compensation committee, after receiving recommendations from our chief executive officer, determines the level at which participants are placed in the schedules. A participant’s placement is generally, but not always, determined by reference to the participant’s annual base salary. Benefit levels in the amended schedule, which became effective on January 1, 2010, are 20% lower than the benefit levels in the original schedule. The amended schedule applies to new participants and participants who receive a benefit level increase on or after January 1, 2010. None of the named executive officers have received a benefit level increase since the amended schedule became effective. | | | | | | 36 | MDU Resources Group, Inc.Proxy Statement |
Participants can elect to receive (1) the regular SISP benefit only, (2) the SISP death benefit only, or (3) a combination of both. Regardless of the participant’s election, if the participant dies before the regular SISP benefit would commence, only the SISP death benefit is provided. If the participant elects to receive both a regular SISP benefit and a SISP death benefit, each of the benefits is reduced proportionately. The regular SISP benefits reflected in the table above are based on the assumption that the participant elects to receive only the regular SISP benefit. The present values of the SISP death benefits that would be provided if the named executive officers had died on December 31, 2011,2012, prior to the commencement of regular SISP benefits, are reflected in the table that appears in the section entitled “Potential Payments upon Termination or Change of Control.” Regular SISP benefits that were vested as of December 31, 2004, and were thereby grandfathered under Section 409A of the Internal Revenue Code remain subject to SISP provisions then in effect, which we refer to as SISP I benefits. Regular SISP benefits that are subject to Section 409A of the Internal Revenue Code, which we refer to as SISP II benefits, are governed by amended provisions intended to comply with Section 409A. Participants generally have more discretion with respect to the distributions of their SISP I benefits. | | | | 42
| MDU Resources Group, Inc.Proxy Statement
|
The time and manner in which the regular SISP benefits are paid depend on a variety of factors, including the time and form of benefit elected by the participant and whether the benefits are SISP I or SISP II benefits. Unless the participant elects otherwise, the SISP I benefits are paid over 180 months, with benefits commencing when the participant attains age 65 or, if later, when the participant retires. The SISP II benefits commence when the participant attains age 65 or, if later, when the participant retires, subject to a six-month delay if the participant is subject to the provisions of Section 409A of the Internal Revenue Code that require delayed commencement of these types of retirement benefits. The SISP II benefits are paid over 180 months or, if commencement of payments is delayed for six months, 173 months. If the commencement of benefits is delayed for six months, the first payment includes the payments that would have been paid during the six-month period plus interest equal to one-half of the annual prime interest rate on the participant’s last date of employment. If the participant dies after the regular SISP benefits have begun but before receipt of all of the regular SISP benefits, the remaining payments are made to the participant’s designated beneficiary. Rather than receiving their regular SISP I benefits in equal monthly installments over 15 years commencing at age 65, participants can elect a different form and time of commencement of their SISP I benefits. Participants can elect to defer commencement of the regular SISP I benefits. If this is elected, the participant retains the right to receive a monthly SISP death benefit if death occurs prior to the commencement of the regular SISP I benefit. Participants also can elect to receive their SISP I benefits in one of three actuarially equivalent forms – a life annuity, 100% joint and survivor annuity, or a joint and two-thirds joint and survivor annuity, provided that the cost of providing these actuarial equivalent forms of benefits does not exceed the cost of providing the normal form of benefit. Neither the election to receive an actuarialactuarially equivalent benefit nor the administrator’s right to pay the regular SISP benefit in the form of an actuarially equivalent lump sum are available with respect to SISP II benefits. To promote retention, the regular SISP benefits are subject to the following 10-year vesting schedule: | | • | 0% vesting for less than 3 years of participation | | | • | 20% vesting for 3 years of participation | | | • | 40% vesting for 4 years of participation and | | | • | an additional 10% vesting for each additional year of participation up to 100% vesting for 10 years of participation. |
There is an additional vesting requirement on benefit level increases for the regular SISP benefit granted on or after January 1, 2010. The requirement applies only to the increased benefit level. The increased benefit vests after the later of three additional years of participation in the SISP or the end of the regular vesting schedule described above. The additional three-year vesting requirement for benefit level increases is pro-rated for participants who are officers, attain age 65, and, pursuant to the company’s bylaws, are required to retire prior to the end of the additional vesting period as follows: | | • | 33% of the increase vests for participants required to retire at least one year but less than two years after the increase is granted and | | | • | 66% of the increase vests for participants required to retire at least two years but less than three years after the increase is granted. |
| | | 1 | | | | MDU Resources Group, Inc.Proxy Statement | 37 |
The benefit level increases of participants who attain age 65 and are required to retire pursuant to the company’s bylaws will be further reduced to the extent the participants are not fully vested in their regular SISP benefit under the 10-year vesting schedule described above. The additional vesting period associated with a benefit level increase may be waived by the compensation committee. SISP death benefits become fully vested if the participant dies while actively employed. Otherwise, the SISP death benefits are subject to the same vesting schedules as the regular SISP benefits. The SISP also provides that if a participant becomes totally disabled, the participant will continue to receive credit for up to two additional years under the SISP as long as the participant is totally disabled during such time. Since the named executive officers other than Messrs.Mr. Schwartz and Harp are fully vested in their SISP benefits, this would not result in any incremental benefit for the named executive officers other than Messrs. Schwartz and Harp.Mr. Schwartz. The present value of these two additional years of service for Messrs.Mr. Schwartz and Harp areis reflected in the table in “Potential Payments upon Termination or Change of Control” below. SISP Excess Benefits
SISP excess benefits are equal to the difference between (1) the monthly retirement benefits that would have been payable to the participant under the pension plans absent the limitations under the Internal Revenue Code and (2) the actual benefits payable to the participant under the pension plans. Participants are only eligible for the SISP excess benefits if (1) the participant is fully vested under the
| | | | MDU Resources Group, Inc.Proxy Statement
| 43
|
| Proxy Statement
SISP Excess Benefits
|
SISP excess benefits are equal to the difference between (1) the monthly retirement benefits that would have been payable to the participant under the pension plans absent the limitations under the Internal Revenue Code and (2) the actual benefits payable to the participant under the pension plans. Participants are only eligible for the SISP excess benefits if (1) the participant is fully vested under the pension plan, (2) the participant’s employment terminates prior to age 65, and (3) benefits under the pension plan are reduced due to limitations under the Internal Revenue Code on plan compensation. Effective January 1, 2005, participants who were not then vested in the SISP excess benefits were also required to remain actively employed by the company until age 60. In 2009, the plan was amended to limit eligibility for the SISP excess benefit to current SISP participants (1) who were already vested in the SISP excess benefit or (2) who would become vested in the SISP excess benefits if they remain employed with the company until age 60. The plan was further amended to freeze the SISP excess benefits to a maximum of the benefit level payable based on the participant’s years of service and compensation level as of December 31, 2009. Messrs. Hildestad, Bietz, and Schneider would be entitled to the SISP excess benefit if they were to terminate employment prior to age 65. Mr. Harp must remain employed until age 60 to become entitled to his SISP excess benefit. Messrs. Schwartz and Wells are not eligible for this benefit. | |
Benefits generally commence six months after the participant’s employment terminates and continue to age 65 or until the death of the participant, if prior to age 65. If a participant who dies prior to age 65 elected a joint and survivor benefit, the survivor’s SISP excess benefit is paid until the date the participant would have attained age 65. Mr. Harp’s Additional Retirement Benefit
To encourage Mr. Harp to remain with the company, on November 16, 2006, upon recommendation of our chief executive officer and the compensation committee, our board of directors approved an additional retirement benefit for Mr. Harp. The benefit provides for Mr. Harp to receive payments that represent the equivalent of an additional three years of service under the pension plan, SISP excess, and SISP II. The additional three years of service recognize Mr. Harp’s previous employment with a subsidiary of the company. To calculate payments Mr. Harp could receive due to his additional retirement benefit, we applied the additional years of service to each of the retirement arrangements and assumed he remained employed until age 60, for purposes of calculating the additional benefit under the pension plan and SISP excess, and age 65, for purposes of calculating the additional benefit under the SISP II. Since the pension plan and SISP excess were frozen as of December 31, 2009, no additional accruals will be recognized. Because we calculate the amounts shown in the table based on an assumption that the named executive officers are 100% vested in their SISP benefits, the additional years of service provided by the agreement would not increase his SISP II benefit reflected in the table. Consequently, the additional retirement benefit amount shown in the table does not include any additional benefit attributable to the SISP II. If Mr. Harp were to retire before achieving 10 years of service and becoming fully vested in his SISP II benefit, the additional years of service provided by the additional retirement benefit would increase his vesting percentage under the SISP II and, therefore, would increase his benefits under the SISP II. For a description of the payments that could be provided under the additional retirement benefit if Mr. Harp’s employment were to be terminated on December 31, 2011, refer to the table and related notes in “Potential Payment upon Termination or Change of Control” below.
Nonqualified Deferred Compensation for 20112012 | | | | | | | | | | | | | | | | | | | | | | | | | | | | | | | | | | | Executive | | Registrant | | Earnings in | | Aggregate | | Aggregate | | | | | Contributions in | | Contributions in | | Aggregate | | Withdrawals/ | | Balance at | | | | | Last FY | | Last FY | | Last FY | | Distributions | | Last FYE | | | Name | | ($) | | ($) | | ($) | | ($) | | ($) | | | (a) | | (b) | | (c) | | (d) | | (e) | | (f) | | | Name
(a) | | | Executive
Contributions in
Last FY
($)
(b) | | Registrant
Contributions in
Last FY
($)
(c) | | Earnings in
Aggregate
Last FY
($)
(d) | | Aggregate
Withdrawals/
Distributions
($)
(e) | | Aggregate
Balance at
Last FYE
($)
(f) | | Terry D. Hildestad | | — | | — | | 52,968 | | — | | 948,527 | | | — | | — | | 53,105 | | — | | 1,001,633 | | Doran N. Schwartz | | — | | — | | — | | — | | — | | | — | | — | | — | | — | | — | | John G. Harp | | — | | — | | — | | — | | — | | | Steven L. Bietz | | | — | | — | | — | | — | | — | | J. Kent Wells | | — | | — | | — | | — | | — | | | — | | — | | — | | — | | — | | William E. Schneider | | 37,805 | | — | | 86,836 | | — | | 1,559,891(1 | ) | | — | | — | | 87,334 | | — | | 1,647,225 | (1) | | | | | | | | | | | | | |
| | | (1) | Includes $392,000 which was reported in the Summary Compensation Table for 2006 in column (g) and $37,805 which is reported for 2010 in column (g) of the Summary Compensation Table in this proxy statement. | | | | |
Participants in the executive incentive compensation plans may elect to defer up to 100% of their annual incentive awards. Deferred amounts accrue interest at a rate determined annually by the compensation committee. The interest rate in effect for 20112012 was 5.76%5.46% or the “Moody’s Rate,” which is the average of (i) the number that results from adding the daily Moody’s U.S. Long-Term Corporate Bond Yield Average for “A” rated companies as of the last day of each month for the 12-month period ending October 31 and dividing by 12 and (ii) the number that results from adding the daily Moody’s U.S. Long-Term Corporate Bond Yield Average for “BBB” rated companies as of the last day of each month for the 12-month period ending October 31 and dividing by 12. The deferred amount will be paid in accordance with the participant’s election, following termination of employment or beginning in the fifth year following the year the award was granted. The amounts will be paid in accordance with the participant’s election in a lump sum or in monthly installments not to exceed 120 months. In the event of a change of control, all amounts become immediately payable. | | | | | | 4438
| MDU Resources Group, Inc.Proxy Statement |
A change of control is defined as: | | • | an acquisition during a 12-month period of 30% or more of the total voting power of our stock | | | • | an acquisition of our stock that, together with stock already held by the acquirer, constitutes more than 50% of the total fair market value or total voting power of our stock | | | • | replacement of a majority of the members of our board of directors during any 12-month period by directors whose appointment or election is not endorsed by a majority of the members of our board of directors or | | | • | acquisition of our assets having a gross fair market value at least equal to 40% of the total gross fair market value of all of our assets. |
Potential Payments upon Termination or Change of Control
The following tables show the payments and benefits our named executive officers would receive in connection with a variety of employment termination scenarios and upon a change of control. For the named executive officers, the information assumes the terminations and the change of control occurred on December 31, 2011.2012. All of the payments and benefits described below would be provided by the company or its subsidiaries. The tables exclude compensation and benefits provided under plans or arrangements that do not discriminate in favor of the named executive officers and that are generally available to all salaried employees, such as benefits under our qualified defined benefit pension plan (for employees hired before 2006), accrued vacation pay, continuation of health care benefits, and life insurance benefits. The tables also do not include the named executive officers’ benefits under our nonqualified deferred compensation plans, which are reported in the Nonqualified Deferred Compensation for 20112012 table. See the Pension Benefits for 20112012 table and the Nonqualified Deferred Compensation for 20112012 table, and accompanying narratives, for a description of the named executive officers’ accumulated benefits under our qualified defined benefit pension plans and our nonqualified deferred compensation plans. The calculation of the present value of excess SISP benefits our named executive officers would be entitled to upon termination of employment under the SISP was computed based on calculations assuming an age rounded to the nearest whole year of age. Actual payments may differ. The terms of the excess SISP benefit are described following the Pension Benefits for 2012 table. We provide disability benefits to some of our salaried employees equal to 60% of their base salary, subject to a cap on the amount of base salary taken into account when calculating benefits. For officers, the limit on base salary is $200,000. For other salaried employees, the limit is $100,000. For all salaried employees, disability payments continue until age 65 if disability occurs at or before age 60 and for 5 years if disability occurs between the ages of 60 and 65. Disability benefits are reduced for amounts paid as retirement benefits. The amounts in the tables reflect the present value of the disability benefits attributable to the additional $100,000 of base salary recognized for executives under our disability program, subject to the 60% limitation, after reduction for amounts that would be paid as retirement benefits. As the tables reflect, with the exception of Messrs. Schwartz and Harp, the reduction for amounts paid as retirement benefits would eliminate disability benefits assuming a termination of employment on December 31, 2011. The table2012 for Mr. Wells does not reflect a disability benefit as he had not exhausted the eligibility waiting period of one year as of December 31, 2011. According to the terms of Mr. Wells’ letter agreement, we agreed to pay Mr. Wells a guaranteed minimum payment of 100% of target of his annual incentive award under the WBI Holdings, Inc. Executive Incentive Compensation Plan, prorated to reflect his May 2, 2011 hire date. In addition, if Mr. Wells’ employment had ended before January 2, 2012, due to a change of control, as defined in Section 409A of the Internal Revenue Code of 1986, as amended, we agreed to pay Mr. Wells’ additional annual incentive of $1.85 million in full if the performance goal was met.Messrs. Hildestad, Bietz, and Schneider.
Upon a change of control, share-based awards granted under our Long-Term Performance-Based Incentive Plan vest and non-share-based awards are paid in cash. All performance share awards for Messrs. Hildestad, Schwartz, Harp,Bietz, Wells, and Schneider and the annual incentives for Messrs. Hildestad, Harp,Bietz, Wells, and Schneider, which were awarded under the Long-Term Performance-Based Incentive Plan, would vest at their target levels. For this purpose, the term “change of control” is defined as: | | • | the acquisition by an individual, entity, or group of 20% or more of our outstanding common stock | | | • | a change in a majority of our board of directors since April 22, 1997, without the approval of a majority of the board members as of April 22, 1997, or whose election was approved by such board members | | | • | consummation of a merger or similar transaction or sale of all or substantially all of our assets, unless our stockholders immediately prior to the transaction beneficially own more than 60% of the outstanding common stock and voting power of the resulting corporation in substantially the same proportions as before the merger, no person owns 20% or more of the resulting corporation’s outstanding common stock or voting power except for any such ownership that existed before the merger and at least a majority of the board of the resulting corporation is comprised of our directors or | | | • | stockholder approval of our liquidation or dissolution. |
| | | | | | MDU Resources Group, Inc.Proxy Statement | 4539
|
Performance share awards will be forfeited if the participant’s employment terminates for any reason before the participant has reached age 55 and completed 10 years of service. Performance shares and related dividend equivalents for those participants whose employment is terminated other than for cause after the participant has reached age 55 and completed 10 years of service will be prorated as follows: | | • | if the termination of employment occurs during the first year of the performance period, the shares are forfeited | | | • | if the termination of employment occurs during the second year of the performance period, the executive receives a prorated portion of any performance shares earned based on the number of months employed during the performance period and | | | • | if the termination of employment occurs during the third year of the performance period, the executive receives the full amount of any performance shares earned. |
Of the named executive officers with performance share awards, only Mr.As of December 31, 2012, Messrs. Schwartz, Bietz, and Wells had not satisfied this requirement as of December 31, 2011.requirement. Accordingly, if a December 31, 20112012 termination other than for cause without a change of control is assumed, the named executive officers’ 2011-20132012-2014 performance share awards would be forfeited, any amounts earned under the 2011-2013 performance share awards for Messrs. Hildestad and Schneider would be reduced by one-third and such award for Messrs. Schwartz and Bietz would be forfeited, and any amounts earned under the 2010-2012 performance share awards for Messrs. Hildestad Harp, and Schneider would be reduced by one-third and such award for Mr. Schwartz would be forfeited, and any amounts earned under the 2009-2011 performance share awards for Messrs. Hildestad, Harp, and Schneider would not be reduced and the award for Mr.Messrs. Schwartz and Bietz would be forfeited. Mr. Wells had no 2011-2013 or 2010-2012 performance share awards. The number of performance shares earned following a termination depends on actual performance through the full performance period. As actual performance for the 2009-20112010-2012 performance share awards has been determined, the amounts for these awards in the event of a termination without a change of control were based on actual performance, which resulted in vesting of 0% of the target award. For the 2010-20122011-2013 performance share awards, because we do not know what actual performance through the entire performance period will be, we have assumed target performance will be achieved and, therefore, show two-thirds of the target award. No amounts are shown for the 2011-20132012-2014 performance share awards because such awards would be forfeited. Although vesting would only occur after completion of the performance period, the amounts shown in the tables were not reduced to reflect the present value of the performance shares that could vest. Dividend equivalents attributable to earned performance shares would also be paid. Dividend equivalents accrued through December 31, 2011,2012, are included in the amounts shown.
The value of the vesting of performance shares shown in the tables was determined by multiplying the number of performance shares that would vest due to termination or a change of control by the closing price of our stock on December 31, 2011. Except for Messrs. Hildestad and Wells, we also have change of control employment agreements with our named executive officers and other executives, which provide certain protections to the executives in the event there is a change of control of the company. Mr. Hildestad requested that his change of control employment agreement be terminated in June 2010. The compensation committee notified other executives with change of control employment agreements that their agreements would not be extended beyond their current expiration dates.
For these purposes, we define “change of control” as:
| | •
| the acquisition by an individual, entity, or group of 20% or more of our outstanding common stock
| | | •
| a change in a majority of our board of directors since the date of the agreement without the approval of a majority of the board members as of the date of the agreement or whose election was approved by such board members
| | | •
| consummation of a merger of similar transaction or sale of all or substantially all of our assets, unless our stockholders immediately prior to the transaction beneficially own more than 60% of the outstanding common stock and voting power of the resulting corporation in substantially the same proportions as before the merger, no person owns 20% or more of the resulting corporation’s outstanding common stock or voting power except for any such ownership that existed before the merger and at least a majority of the board of the resulting corporation is comprised of our directors or
| | | •
| stockholder approval of our liquidation or dissolution.
| | | If a change of control occurs, the agreements provide for a three-year employment period from the date of the change of control, during which the named executive officer is entitled to receive:
| | | •
| a base salary of not less than twelve times the highest monthly salary paid within the preceding twelve months
| | | •
| annual incentive opportunity of not less than the highest annual incentive paid in any of the three years before the change of control
| | | •
| participation in our incentive, savings, retirement, and welfare benefit plans
| | | •
| reasonable vehicle allowance, home office allowance, and subsidized annual physical examinations and
| | | •
| office and support staff, vacation, and expense reimbursement consistent with such benefits as they were provided before the change of control.
|
| | | | 46
| MDU Resources Group, Inc.Proxy Statement
|
Assuming a change of control occurred on December 31, 2011, the guaranteed minimum level of base salary provided over the three-year employment period would not result in an increase in any of the named executive officers’ base salaries. The minimum annual incentive opportunities Messrs. Schwartz, Harp, and Schneider would be eligible to earn over the three-year employment period would be $543,780, $1,316,250, and $1,744,860, respectively. The agreements also provide that severance payments and benefits will be provided:
| | •
| if we terminate the named executive officer’s employment during the employment period, other than for cause or disability, or
| | | •
| the named executive officer resigns for good reason.
| | | “Cause” means the named executive officer’s willful and continued failure to substantially perform his duties or willfully engaging in illegal conduct or gross misconduct materially injurious to the company. “Good reason” includes:
| | | •
| a material diminution of the named executive officer’s authority, duties, or responsibilities
| | | •
| a material change in the named executive officer’s work location and
| | | •
| our material breach of the agreement.
| | | In such event, the named executive officer would receive:
| | | •
| accrued but unpaid base salary and accrued but unused vacation
| | | •
| a lump sum payment equal to three times his (a) annual salary using the higher of the then current annual salary or twelve times the highest monthly salary paid within the twelve months before the change of control and (b) annual incentive using the highest annual incentive paid in any of the three years before the change of control or, if higher, the annual incentive for the most recently completed fiscal year
| | | •
| a pro-rated annual incentive for the year of termination
| | | •
| an amount equal to the actuarial equivalent of the additional benefit the named executive officer would receive under the SISP and any other supplemental or excess retirement plan if employment continued for an additional three years
| | | •
| outplacement benefits and
| | | •
| a payment equal to any federal excise tax on excess parachute payments if the total parachute payments exceed 110% of the safe harbor amount for that tax. If this 110% threshold is not exceeded, the named executive officer’s payments and benefits would be reduced to avoid the tax. The named executive officers are not reimbursed for any taxes imposed on this tax reimbursement payment.
|
This description of severance payments and benefits reflects the terms of the agreements as in effect on December 31, 2011.2012.
The compensation committee may also consider providing severance benefits on a case-by-case basis for employment terminations not related to a change of control.terminations. The compensation committee adopted a checklist of factors in February 2005 to consider when determining whether any such severance benefits should be paid. The tables do not reflect any such severance benefits, as these benefits are made in the discretion of the committee on a case-by-case basis and it is not possible to estimate the severance benefits, if any, that would be paid. | | | | | | 40 | MDU Resources Group, Inc.Proxy Statement | 47
|
Terry D. Hildestad | | | | | | | | | | | | | | | | | | | | | | | | | | | | | | | | | | | | | | | | | | | | | | | | Change of | | Change of | | | Executive Benefits and | | | | Not for | | | | | | | | Control | | Control | | | Payments Upon | | Voluntary | | Cause | | For Cause | | | | | | (With | | (Without | | | Termination or | | Termination | | Termination | | Termination | | Death | | Disability | | Termination) | | Termination) | | | Change of Control | | ($) | | ($) | | ($) | | ($) | | ($) | | ($) | | ($) | | | Executive Benefits and
Payments Upon
Termination or
Change of Control | | | Voluntary
Termination
($) | | Not for
Cause
Termination
($) | | For Cause
Termination
($) | Death
($) | | Disability
($) | | Change of
Control
(With
Termination)
($) | | Change of
Control
(Without
Termination)
($) | | Compensation: | | | | | | | | | | | | | | | | | | | | | | | | | | | | | Short-term Incentive(1) | | | | | | | | | | | | 750,000 | | 750,000 | | | | | | | | | | | 750,000 | | 750,000 | | 2009-2011 Performance Shares | | | | | | | | | | | | 1,281,374 | | 1,281,374 | | | 2010-2012 Performance Shares | | 723,587 | | 723,587 | | | | 723,587 | | 723,587 | | 1,085,380 | | 1,085,380 | | | | | | | | | | | 1,107,087 | | 1,107,087 | | 2011-2013 Performance Shares | | | | | | | | | | | | 1,199,584 | | 1,199,584 | | | 816,176 | | 816,176 | | | 816,176 | | 816,176 | | 1,224,265 | | 1,224,265 | | 2012-2014 Performance Shares | | | | | | | | | | | 1,144,577 | | 1,144,577 | | Benefits and Perquisites: | | | | | | | | | | | | | | | | | | | | | | | | | | | | | Regular SISP(2) | | 5,242,870 | | 5,242,870 | | | | | | 5,242,870 | | 5,242,870 | | | | | 5,709,419 | | 5,709,419 | | | | 5,709,419 | | 5,709,419 | | | | Excess SISP(3) | | 552,948 | | 552,948 | | | | | | 552,948 | | 552,948 | | | | | 378,944 | | 378,944 | | | | 378,944 | | 378,944 | | | | SISP Death Benefits(4) | | | | | | | | 11,586,607 | | | | | | | | | | | | | | 12,024,426 | | | | | | | | Total | | 6,519,405 | | 6,519,405 | | | | 12,310,194 | | 6,519,405 | | 10,112,156 | | 4,316,338 | | | 6,904,539 | | 6,904,539 | | | 12,840,602 | | 6,904,539 | | 10,314,292 | | 4,225,929 | |
| | (1) | Represents the target 20112012 annual incentive, which would be deemed earned upon change of control under the Long-Term Performance-Based Incentive Plan. | (2) | Represents the present value of Mr. Hildestad’s vested regular SISP benefit as of December 31, 2011,2012, which was $42,710 per month for 15 years, commencing at age 65. Present value was determined using a 4.00%3.45% discount rate. The terms of the regular SISP benefit are described following the Pension Benefits for 20112012 table. | (3) | Represents the present value of all excess SISP benefits Mr. Hildestad would be entitled to upon termination of employment under the SISP. Present value was determined using a 4.00%3.45% discount rate. The terms of the excess SISP benefit are described following the Pension Benefits for 20112012 table. | (4) | Represents the present value of 180 monthly payments of $85,420 per month, which would be paid as a SISP death benefit under the SISP. Present value was determined using a 4.00%3.45% discount rate. The terms of the SISP death benefit are described following the Pension Benefits for 20112012 table. |
| | | | 48
| MDU Resources Group, Inc.Proxy Statement | 41 |
| Proxy Statement | | | Doran N. Schwartz
|
Doran N. Schwartz | | | | | | | | | | | | | | | | | | | | | Executive Benefits and
Payments Upon
Termination or
Change of Control | | Voluntary
Termination
($) | | Not for
Cause
Termination
($) | | For Cause
Termination
($) | Death
($) | | Disability
($) | | Change of
Control
(With
Termination)
($) | | Change of
Control
(Without
Termination)
($) | | Compensation: | | | | | | | | | | | | | | | | | | | | | 2010-2012 Performance Shares | | | | | | | | | | | | | | | | 191,882 | | | 191,882 | | 2011-2013 Performance Shares | | | | | | | | | | | | | | | | 222,811 | | | 222,811 | | 2012-2014 Performance Shares | | | | | | | | | | | | | | | | 228,902 | | | 228,902 | | Benefits and Perquisites: | | | | | | | | | | | | | | | | | | | | | Regular SISP | | | 244,273 | (1) | | 244,273 | (1) | | | | | | 341,982 | (2) | | 244,273 | (1) | | | | SISP Death Benefits(3) | | | | | | | | | | 2,055,217 | | | | | | | | | | | Disability Benefits(4) | | | | | | | | | | | | | 855,522 | | | | | | | | Total | | | 244,273 | | | 244,273 | | | | 2,055,217 | | | 1,197,504 | | | 887,868 | | | 643,595 | |
| | | | | | | | | | | | | | | Executive Benefits and
Payments Upon
Termination or
Change of Control | | Voluntary
Termination
($) | | Not for
Cause
Termination
($) | | For Cause
Termination
($) | | Death
($) | | Disability
($) | | Not for
Cause
or Good
Reason
Termination
Following
Change of
Control
($) | | Change of
Control
(Without
Termination)
($) | Compensation: | | | | | | | | | | | | | | | Base Salary | | | | | | | | | | | | 819,000 | | | Short-term Incentive(1) | | | | | | | | | | | | 725,040 | | | 2009-2011 Performance Shares | | | | | | | | | | | | 114,689 | | 114,689 | 2010-2012 Performance Shares | | | | | | | | | | | | 188,120 | | 188,120 | 2011-2013 Performance Shares | | | | | | | | | | | | 218,319 | | 218,319 | Benefits and Perquisites: | | | | | | | | | | | | | | | Regular SISP | | 160,738 | (2) | 160,738 | (2) | | | | | 241,107 | (3) | 281,292 | (4) | | SISP Death Benefits(5) | | | | | | | | 1,980,385 | | | | | | | Disability Benefits(6) | | | | | | | | | | 842,408 | | | | | Outplacement Services | | | | | | | | | | | | 50,000 | | | 280G Tax(7) | | | | | | | | | | | | 417,848 | | | Total | | 160,738 | | 160,738 | | | | 1,980,385 | | 1,083,515 | | 2,814,308 | | 521,128 |
| | (1) | Includes the prorated annual incentive for the year of termination, which is the full annual incentive since we assume termination occurred on December 31, 2011, and the additional severance payment of three times the annual incentive. For each of these, we used the higher of (1) the annual incentive earned in 2011 or (2) the highest annual incentive paid in 2009, 2010, and 2011.
| (2)
| Represents the present value of Mr. Schwartz’s vested regular SISP benefit as of December 31, 2011,2012, which was $2,920$3,650 per month for 15 years, commencing at age 65. Present value was determined using a 4.00%3.45% discount rate. The terms of the regular SISP benefit are described following the Pension Benefits for 20112012 table. | (3)(2)
| Represents the present value of Mr. Schwartz’s vested SISP benefit described in footnote 2,1, adjusted to reflect the increase in the present value of his regular SISP benefit that would result from an additional two years of vesting under the SISP. Present value was determined using a 4.00%3.45% discount rate. | (4)
| Represents the payment that would be made under Mr. Schwartz’s change of control agreement based on the increase in the actuarial present value of his regular SISP benefit that would result if he continued employment for an additional three years.
| (5)(3)
| Represents the present value of 180 monthly payments of $14,600 per month, which would be paid as a SISP death benefit under the SISP. Present value was determined using a 4.00%3.45% discount rate. The terms of the SISP death benefit are described following the Pension Benefits for 20112012 table. | (6)(4)
| Represents the present value of the disability benefit after reduction for amounts that would be paid as retirement benefits. Present value was determined using a 4.11%3.59% discount rate. | (7)
| Determined applying the Internal Revenue Code Section 4999 excise tax of 20% only if 110% threshold is exceeded.
|
| | 42 | | MDU Resources Group, Inc.Proxy Statement | 49
|
| Proxy Statement | | | John G. Harp
|
Steven L. Bietz | | | | | | | | | | | | | | | | | | | | | Executive Benefits and
Payments Upon
Termination or
Change of Control | | Voluntary
Termination
($) | | Not for
Cause
Termination
($) | | For Cause
Termination
($) | Death
($) | | Disability
($) | | Change of
Control
(With
Termination)
($) | | Change of
Control
(Without
Termination)
($) | | Compensation: | | | | | | | | | | | | | | | | | | | | | Short-term Incentive(1) | | | | | | | | | | | | | | | | 234,325 | | | 234,325 | | 2010-2012 Performance Shares | | | | | | | | | | | | | | | | 309,972 | | | 309,972 | | 2011-2013 Performance Shares | | | | | | | | | | | | | | | | 353,063 | | | 353,063 | | 2012-2014 Performance Shares | | | | | | | | | | | | | | | | 330,084 | | | 330,084 | | Benefits and Perquisites: | | | | | | | | | | | | | | | | | | | | | Regular SISP(2) | | | 1,556,929 | | | 1,556,929 | | | | | | | 1,556,929 | | | 1,556,929 | | | | | Excess SISP(3) | | | 180,597 | | | 180,597 | | | | | | | 180,597 | | | 180,597 | | | | | SISP Death Benefits(4) | | | | | | | | | | 4,535,554 | | | | | | | | | | | Total | | | 1,737,526 | | | 1,737,526 | | | | 4,535,554 | | | 1,737,526 | | | 2,964,970 | | | 1,227,444 | |
| | | | | | | | | | | | | | | | Executive Benefits and
Payments Upon
Termination or
Change of Control | | Voluntary
Termination
($) | | Not for
Cause
Termination
($) | | For Cause
Termination
($) | | Death
($) | | Disability
($) | | Not for
Cause
or Good
Reason
Termination
Following
Change of
Control
($) | | Change of
Control
(Without
Termination)
($) | | Compensation: | | | | | | | | | | | | | | | | Base Salary | | | | | | | | | | | | 1,350,000 | | | | Short-term Incentive | | | | | | | | | | | | 1,755,000 | (1) | 292,500 | (2) | 2009-2011 Performance Shares | | | | | | | | | | | | 461,280 | | 461,280 | | 2010-2012 Performance Shares | | 260,488 | | 260,488 | | | | 260,488 | | 260,488 | | 390,731 | | 390,731 | | 2011-2013 Performance Shares | | | | | | | | | | | | 431,840 | | 431,840 | | Benefits and Perquisites: | | | | | | | | | | | | | | | | Incremental Pension(3) | | 136,432 | | 136,432 | | | | | | 136,432 | | 136,432 | | | | Regular SISP | | 2,215,163 | (4) | 2,215,163 | (4) | | | | | 2,461,292 | (5) | 2,461,292 | (6) | | | SISP Death Benefits(7) | | | | | | | | 6,198,875 | | | | | | | | Disability Benefits(8) | | | | | | | | | | 178,455 | | | | | | Outplacement Services | | | | | | | | | | | | 50,000 | | | | 280G Tax(9) | | | | | | | | | | | | 718,845 | | | | Total | | 2,612,083 | | 2,612,083 | | | | 6,459,363 | | 3,036,667 | | 7,755,420 | | 1,576,351 | |
| | (1) | Includes the prorated annual incentive for the year of termination, which is the full annual incentive since we assume termination occurred on December 31, 2011, and the additional severance payment of three times the annual incentive. For each of these, we used the higher of (1) the annual incentive earned in 2011 or (2) the highest annual incentive paid in 2009, 2010, and 2011.
| (2)
| Represents the target 20112012 annual incentive, which would be deemed earned upon change of control under the Long-Term Performance-Based Incentive Plan. | (3)
| Represents the equivalent of three additional years of service that would be provided under the Harp additional retirement benefit described following the Pension Benefits for 2011 table. Present value was determined using a 4.11% discount rate.
| (4)(2)
| Represents the present value of Mr. Harp’sBietz’s vested regular SISP benefit as of December 31, 2011,2012, which was $20,565$16,110 per month for 15 years, commencing at age 65. Present value was determined using a 4.00%3.45% discount rate. The terms of the regular SISP benefit are described following the Pension Benefits for 2011 table. Also includes the additional benefit attributable to three additional years of service that would be provided under the retirement benefit agreement described following the Pension Benefits for 20112012 table. | (5)(3)
| Represents the present value of all excess SISP benefits Mr. Harp’s vested SISP benefit described in footnote 4, adjustedBietz would be entitled to reflect the increase in the present valueupon termination of his regular SISP benefit that would result from an additional two years of vestingemployment under the SISP. Present value was determined using a 4.00%3.45% discount rate. The terms of the excess SISP benefit are described following the Pension Benefits for 2012 table. | (4) | Represents the present value of 180 monthly payments of $32,220 per month, which would be paid as a SISP death benefit under the SISP. Present value was determined using a 3.45% discount rate. The terms of the SISP death benefit are described following the Pension Benefits for 2012 table. |
| | MDU Resources Group, Inc. Proxy Statement | 43 |
J. Kent Wells | | | | | | | | | | | | | | | | | | | | | | | Executive Benefits and
Payments Upon
Termination or
Change of Control | | Voluntary
Termination
($) | | Not for
Cause
Termination
($) | | For Cause
Termination
($) | | Death
($) | | Disability
($) | | Change of
Control
(With
Termination)
($) | | Change of
Control
(Without
Termination)
($) | | Compensation: | | | | | | | | | | | | | | | | | | | | | | | Short-term Incentive(1) | | | | | | | | | | | | | | | | | | 687,500 | | | 687,500 | | 2012-2014 Performance Shares | | | | | | | | | | | | | | | | | | 1,119,133 | | | 1,119,133 | | Benefits and Perquisites: | | | | | | | | | | | | | | | | | | | | | | | Disability Benefits (2) | | | | | | | | | | | | | | | 452,506 | | | | | | | | Total | | | | | | | | | | | | | | | 452,506 | | | 1,806,633 | | | 1,806,633 | |
| | (1) | Represents the target 2012 annual incentive, which would be deemed earned upon change of control under the Long-Term Performance-Based Incentive Plan. | | | (2) | Represents the present value of the disability benefit. Present value was determined using a 3.76% discount rate. |
(6)
| | | | 44 | MDU Resources Group, Inc. Proxy Statement |
William E. Schneider | | | | | | | | | | | | | | | | | | | | | | | Executive Benefits and
Payments Upon
Termination or
Change of Control | | Voluntary
Termination
($) | | Not for
Cause
Termination
($) | | For Cause
Termination
($) | | Death
($) | | Disability
($) | | Change of
Control
(With
Termination)
($) | | Change of
Control
(Without
Termination)
($) | | Compensation: | | | | | | | | | | | | | | | | | | | | | | | Short-term Incentive(1) | | | | | | | | | | | | | | | | | | 290,810 | | | 290,810 | | 2010-2012 Performance Shares | | | | | | | | | | | | | | | | | | 396,249 | | | 396,249 | | 2011-2013 Performance Shares | | | 292,124 | | | 292,124 | | | | | | 292,124 | | | 292,124 | | | 438,174 | | | 438,174 | | 2012-2014 Performance Shares | | | | | | | | | | | | | | | | | | 409,657 | | | 409,657 | | Benefits and Perquisites: | | | | | | | | | | | | | | | | | | | | | | | Regular SISP(2) | | | 3,161,624 | | | 3,161,624 | | | | | | | | | 3,161,624 | | | 3,161,624 | | | | | SISP Death Benefits(3) | | | | | | | | | | | | 6,433,110 | | | | | | | | | | | Total | | | 3,453,748 | | | 3,453,748 | | | | | | 6,725,234 | | | 3,453,748 | | | 4,696,514 | | | 1,534,890 | |
| | (1) | Represents the target 2012 annual incentive, which would be deemed earned upon change of control under the Long-Term Performance-Based Incentive Plan. | | | (2) | Represents the present value of Mr. Harp’sSchneider’s vested SISP benefit described in footnote 4, adjusted to reflect the increase in the present value of his regular SISP benefit that would result if he continued employmentas of December 31, 2012, which was $22,850 per month for an additional three years.15 years, commencing at age 65. Present value was determined using a 4.00%3.45% discount rate. The terms of the regular SISP benefit are described following the Pension Benefits for 2012 table. | (7)
| | (3) | Represents the present value of 180 monthly payments of $45,700 per month, which would be paid as a SISP death benefit under the SISP. Present value was determined using a 4.00%3.45% discount rate. The terms of the SISP death benefit are described following the Pension Benefits for 20112012 table. | (8)
| Represents the present value of the disability benefit after reduction for amounts that would be paid as retirement benefits. Present value was determined using a 4.11% discount rate.
| (9)
| Determined applying the Internal Revenue Code Section 4999 excise tax of 20% only if 110% threshold is exceeded.
|
| | | | 50
| MDU Resources Group, Inc.Inc. Proxy Statement | 45 |
| Proxy Statement | | | J. Kent Wells
|
| | | | | | | | | | | | | | | | Executive Benefits and
Payments Upon
Termination or
Change of Control | | Voluntary
Termination
($) | | Not for
Cause
Termination
($) | | For Cause
Termination
($) | | Death
($) | | Disability
($) | | Change of
Control
(With
Termination)
($) | | Change of
Control
(Without
Termination)
($) | | Compensation: | | | | | | | | | | | | | | | | Short-term Incentive(1) | | 366,685 | | 366,685 | | 366,685 | | 366,685 | | 366,685 | | 366,685 | | 366,685 | | Additional 2011 Annual Incentive | | | | 1,850,000 | (2) | 1,850,000 | (2) | 1,850,000 | (2) | 1,850,000 | (2) | 1,850,000 | (3) | 1,850,000 | (4) | Total | | 366,685 | | 2,216,685 | | 2,216,685 | | 2,216,685 | | 2,216,685 | | 2,216,685 | | 2,216,685 | |
(1)
| Represents the guaranteed minimum annual incentive payment of 100% of target for 2011, prorated to reflect Mr. Wells’ May 2, 2011 hire date.
| (2)
| Mr. Wells was eligible to receive payment of his 2011 additional annual incentive if he did not resign from Fidelity Exploration & Production Company before January 2, 2012, and the goal was met.
| (3)
| Mr. Wells would receive payment of his 2011 additional annual incentive if Fidelity Exploration & Production Company’s cash flow from operations for 2011 exceeded $132.0 million and his employment ended for any reason before January 2, 2012, due to a change in control of MDU Resources Group, Inc.
| (4)
| Represents the 2011 additional annual incentive, which would be deemed earned upon a change of control under the Long-Term Performance-Based Incentive Plan.
|
| | | | MDU Resources Group, Inc.Proxy Statement
| 51
|
Director Compensation for 2012
| Proxy Statement
| | | William E. Schneider
|
| | | | | | | | | | | | | | | | Executive Benefits and
Payments Upon
Termination or
Change of Control | | Voluntary
Termination
($) | | Not for
Cause
Termination
($) | | For Cause
Termination
($) | | Death
($) | | Disability
($) | | Not for
Cause
or Good
Reason
Termination
Following
Change of
Control
($) | | Change of
Control
(Without
Termination)
($) | | Compensation: | | | | | | | | | | | | | | | | Base Salary | | | | | | | | | | | | 1,342,200 | | | | Short-term Incentive | | | | | | | | | | | | 2,326,480 | (1) | 290,810 | (2) | 2009-2011 Performance Shares | | | | | | | | | | | | 458,615 | | 458,615 | | 2010-2012 Performance Shares | | 258,986 | | 258,986 | | | | 258,986 | | 258,986 | | 388,479 | | 388,479 | | 2011-2013 Performance Shares | | | | | | | | | | | | 429,341 | | 429,341 | | Benefits and Perquisites: | | | | | | | | | | | | | | | | Regular SISP(3) | | 2,919,232 | | 2,919,232 | | | | | | 2,919,232 | | 2,919,232 | | | | Excess SISP | | 46,259 | (4) | 46,259 | (4) | | | | | 46,259 | (4) | 46,259 | (5) | | | SISP Death Benefits(6) | | | | | | | | 6,198,875 | | | | | | | | Outplacement Services | | | | | | | | | | | | 50,000 | | | | 280G Tax(7) | | | | | | | | | | | | 784,127 | | | | Total | | 3,224,477 | | 3,224,477 | | | | 6,457,861 | | 3,224,477 | | 8,744,733 | | 1,567,245 | |
(1)
| Includes the prorated annual incentive for the year of termination, which is the full annual incentive since we assume termination occurred on December 31, 2011, and the additional severance payment of three times the annual incentive. For each of these, we used the higher of (1) the annual incentive earned in 2011 or (2) the highest annual incentive paid in 2009, 2010, and 2011.
| (2)
| Represents the target 2011 annual incentive, which would be deemed earned upon change of control under the Long-Term Performance-Based Incentive Plan.
| (3)
| Represents the present value of Mr. Schneider’s vested regular SISP benefit as of December 31, 2011, which was $22,850 per month for 15 years, commencing at age 65. Present value was determined using a 4.00% discount rate. The terms of the regular SISP benefit are described following the Pension Benefits for 2011 table. The three additional years of vesting credit assumed for purposes of calculating the additional SISP benefit under Mr. Schneider’s change of control agreement would not increase the actuarial present value of his SISP amount.
| (4)
| Represents the present value of all excess SISP benefits Mr. Schneider would be entitled to upon termination of employment under the SISP. Present value was determined using a 4.00% discount rate. The terms of the excess SISP benefit are described following the Pension Benefits for 2011 table.
| (5)
| Represents the present value of all excess SISP benefits Mr. Schneider would be entitled to, calculated with the assumption of three additional years of employment, as provided under Mr. Schneider’s change of control agreement. Present value was determined using a 4.00% discount rate. The terms of the excess SISP benefit are described following the Pension Benefits for 2011 table.
| (6)
| Represents the present value of 180 monthly payments of $45,700 per month, which would be paid as a SISP death benefit under the SISP. Present value was determined using a 4.00% discount rate. The terms of the SISP death benefit are described following the Pension Benefits for 2011 table.
| (7)
| Determined applying the Internal Revenue Code Section 4999 excise tax of 20% only if 110% threshold is exceeded.
|
| | | | 52
| MDU Resources Group, Inc.Proxy Statement
|
| Proxy Statement
| | | Director Compensation for 2011
|
| | | | | | | | | | | | | | | | | | | | | | | | | | | | | | | | | | | | | Name
(a) | | Fees
Earned
or Paid
in Cash
($)
(b) | | Stock
Awards
($)
(c)(1) | | Option
Awards
($)
(d) | | Non-Equity
Incentive Plan
Compensation
($)
(e) | | Change in
Pension
Value and
Nonqualified
Deferred
Compensation
Earnings
($)
(f) | | All Other
Compensation
($)
(g)(2) | | Total
($)
(h) | | Fees
Earned
or Paid
in Cash
($)
(b) | | Stock
Awards
($)
(c)(1) | | Option
Awards
($)
(d) | | Non-Equity
Incentive Plan
Compensation
($)
(e) | | Change in
Pension
Value and
Nonqualified
Deferred
Compensation
Earnings
($)
(f) | | All Other
Compensation
($)
(g)(2) | | Total
($)
(h) | | Thomas Everist | | 62,917 | | 110,000 | | — | (3) | — | | — | | 174 | | 173,091 | | 65,000 | | 110,000 | | — | | — | | — | | 174 | | 175,174 | | Karen B. Fagg | | 62,917 | | 110,000 | | — | | — | | — | | 174 | | 173,091 | | 65,000 | | 110,000 | | — | | — | | — | | 174 | | 175,174 | | A. Bart Holaday | | 55,000 | (4) | 110,000 | | — | | — | | — | | 174 | | 165,174 | | 55,000 | (3) | | 110,000 | | — | | — | | — | | 174 | | 165,174 | | Dennis W. Johnson | | 67,917 | | 110,000 | | — | | — | | — | | 174 | | 178,091 | | 70,000 | | 110,000 | | — | | — | | — | | 174 | | 180,174 | | Thomas C. Knudson | | 55,000 | | 110,000 | | — | | — | | — | | 674 | | 165,674 | | 55,000 | | 110,000 | | — | | — | | — | | 674 | | 165,674 | | Richard H. Lewis | | 55,000 | | 110,000 | | — | | — | | — | | 174 | | 165,174 | | 55,000 | | 110,000 | | — | | — | | — | | 174 | | 165,174 | | Patricia L. Moss | | 55,000 | (5) | 110,000 | | — | | — | | — | | 174 | | 165,174 | | 55,000 | (4) | | 110,000 | | — | | — | | — | | 174 | | 165,174 | | Harry J. Pearce | | 130,000 | | 110,000 | | — | | — | | — | | 174 | | 240,174 | | 130,000 | | 110,000 | | — | | — | | — | | 174 | | 240,174 | | John K. Wilson | | 55,000 | (6) | 110,000 | | — | | — | | — | | 174 | | 165,174 | | 55,000 | (5) | | 110,000 | | — | | — | | — | | 174 | | 165,174 | |
| | (1) | This column reflects the aggregate grant date fair value of 5,4505,467 shares of MDU Resources Group, Inc. stock purchased for our non-employee directors measured in accordance with Financial Accounting Standards Board generally accepted accounting principles for stock based compensation in FASB Accounting Standards Codification Topic 718. The grant date fair value is based on the purchase price of our common stock on the grant date on November 21, 2011,19, 2012, which was $20.181.$20.118. The $14$14.89 in cash paid to each director for the fractional shares is included in the amounts reported in column (c) to this table. | (2) | Group life insurance premium of $174 and a matching charitable contribution of $500 for Mr. Knudson. | (3) | Mr. Everist had 6,750 stock options outstanding as of December 31, 2011.
| (4)
| Includes $14,997$14,999 that Mr. Holaday received in our common stock in lieu of cash. | (5)(4)
| Includes $54,983$27,481 that Ms. Moss received in our common stock in lieu of cash. | (6)(5)
| Includes $54,983$54,982 that Mr. Wilson received in our common stock in lieu of cash. | |
| |
Effective June 1, 2011, the board approved changes to the MDU Resources Group, Inc. Directors’ Compensation Policy. The following table shows the cash and stock retainers payable to our non-employee directors.
| | | | | Base Retainer | | | $55,000 | | Additional Retainers: | | | | | Non-Executive Chairman | | | 75,000 | | Lead Director, if any | | | 33,000 | | Audit Committee Chairman | | | 15,000 | | Compensation Committee Chairman | | | 10,000 | | Nominating and Governance Committee Chairman | | | 10,000 | | Annual Stock Grant(1) | | | 110,000 | |
| | | | | | | | | | Effective
June 1, 2011 | | Prior to
June 1, 2011 | | Base Retainer | | | $55,000 | | | $55,000 | | Additional Retainers: | | | | | | | | Non-Executive Chairman | | | 75,000 | | | 75,000 | | Lead Director, if any | | | 33,000 | | | 33,000 | | Audit Committee Chairman | | | 15,000 | | | 10,000 | | Compensation Committee Chairman | | | 10,000 | | | 5,000 | | Nominating and Governance Committee Chairman | | | 10,000 | | | 5,000 | | Annual Stock Grant(1) | | | 110,000 | | | 4,050 shares | |
| | (1) | Effective for 2011, theThe annual stock grant was changed from a fixed number of shares tois a grant of shares equal in value to $110,000.
|
There are no meeting fees. In addition to liability insurance, we maintain group life insurance in the amount of $100,000 on each non-employee director for the benefit of each director’s beneficiaries during the time each director serves on the board. The annual cost per director is $174. Directors may defer all or any portion of the annual cash retainer and any other cash compensation paid for service as a director pursuant to the Deferred Compensation Plan for Directors. Deferred amounts are held as phantom stock with dividend accruals and are paid out in cash over a five-year period after the director leaves the board. Directors are reimbursed for all reasonable travel expenses including spousal expenses in connection with attendance at meetings of the board and its committees. All amounts together with any other perquisites were below the disclosure threshold for 2011.2012. Our post-retirement income plan for directors was terminated in May 2001 for current and future directors. The net present value of each director’s benefit was calculated and converted into phantom stock. Payment is deferred pursuant to the Deferred Compensation Plan for Directors and will be made in cash over a five-year period after the director’s retirement from the board. | | | | 46 | MDU Resources Group, Inc.Proxy Statement | 53
|
The board revised ourOur director stock ownership policy for directorscontained in November 2010. Eachour corporate governance guidelines requires each director is required, rather than expected, to own our common stock equal in value to five times the director’s annual cash base retainer. Shares acquired through purchases on the open market and participation in our director stock plans will be considered in ownership calculations as will ownership of our common stock by a spouse. A director is allowed five years commencing January 1 of the year following the year of that director’s initial election to the board to meet the requirements. The level of common stock ownership is monitored with an annual report made to the compensation committee of the board. For stock ownership, please see “Security Ownership.”
In our Director Compensation Policy, we prohibit our directors from hedging their ownership of company common stock. Directors may not enter into transactions that allow the director to benefit from devaluation of our stock or otherwise own stock technically but without the full benefits and risks of such ownership.
Narrative Disclosure of our Compensation Policies and Practices
as They Relate to Risk Management
Senior managementThe human resources department has conducted an assessment of the risks arising from our compensation policies and practices for all employees and concluded that none of these risks is reasonably likely to have a material adverse effect on the company. Based on the human resources department’s assessment and taking into account information received from the risk identification process, senior management and our management policy committee concluded that risks arising from our compensation policies and practices for all employees are not reasonably likely to have a material adverse effect on the company. After review and discussion with senior management, the compensation committee concurred with this assessment. As part of its assessment of the risks arising from our compensation policies and practices for all employees, senior managementthe human resources department identified the principal areas of risk faced by the company that may be affected by our compensation policies and practices for all employees, including any risks resulting from our operating businesses’ compensation policies and practices. In assessing the risks arising from our compensation policies and practices, senior managementthe human resources department identified the following practices as factors that servedesigned to mitigate any risks arising from our compensation plans and programs:prevent excessive risk taking: Business management and governance practices | | • | hedging on oil and gas productionrisk management is a specific performance competency to reduce commodity price volatilityannual performance assessment of Section 16 officers
| | | • | board of director oversight on capital expenditure and operating plans that promotes careful consideration of financial assumptions | | | • | limitation on business acquisitions without board of director approval | | | • | employee integrity training programs and anonymous reporting systems | | | • | quarterly risk assessment reports at audit committee meetings and | | | • | prohibitionprohibitions on holding company stock in an account that is subject to a margin call, pledging company stock as collateral for a loan, and hedging of company stock by Section 16 officers and directors.
| | | Compensation practices | | | • | active compensation committee review of executive compensation, including comparison of executive compensation to total stockholder return ratio to the ratio for the performance graph peer group (PEER Analysis) | | | • | the initial determination of a position’s salary grade to be at or near the 50th percentile of base salaries paid to similar positions at peer group companies and/or relevant industry companies | | | • | consideration of peer group and/or relevant industry practices to establish appropriate compensation target amounts | | | • | a balanced compensation mix of fixed salary and annual or long-term incentives tied to ourthe company’s financial performance | | | • | use of interpolation for annual and long-term incentive awards to avoid payout cliffs | | | • | negative discretion to adjust any annual or long-term incentive award payment downward | | | • | use of caps on annual incentive awards and stock granted under long-term incentive stock grant awards (200% of target)target for awards granted in 2012) | | | • | discretionary clawbacks on incentive payments in the event of a financial restatement | | | • | use of performance shares, rather than stock options or stock appreciation rights, as equity component of incentive compensation | | | • | use of performance shares with a relative, rather than an absolute, total stockholder return performance goal and mandatory reduction in award if total stockholder return is negative | | | • | use of three-year performance periods to discourage short-term risk-taking |
| | | | 54
| MDU Resources Group, Inc.Proxy Statement | 47 |
| | • | substantive incentive goals measured primarily by return on invested capital and earnings per share criteria, which encourage balanced performance and are important to stockholders | | | • | use of financial performance metrics that are readily monitored and reviewed | | | • | regular review of the appropriateness of the companies in the performance graph peer group | | | • | stock ownership requirements for executives participating in the MDU Resources Group, Inc. Long-Term Performance-Based Incentive Plan and for the board of directors | | | • | mandatory holding periods for 50% of any net after-tax shares earned under long-term incentive awards granted in 2011 and thereafter and | | | • | use of independent consultants in establishing pay targets at least biennially. |
| | | 48 | MDU Resources Group, Inc.Proxy Statement | 55
|
INFORMATION CONCERNING EXECUTIVE OFFICERS
At the first annual meeting of the board after the annual meeting of stockholders, our board of directors elects our executive officers, who serve until their successors are chosen and qualify. A majority of our board of directors may remove any executive officer at any time. Information concerning our executive officers, including their ages, present corporate positions, and business experience, is as follows: | | | | | Name | | Age | | Present Corporate Position and Business Experience | | | | | | Terry D. HildestadDavid L. Goodin
| | 6251
| | Mr. Goodin was elected President and Chief Executive Officer.Officer of the company and a director effective January 4, 2013. For more information about Mr. Hildestad,Goodin, see “Election of Directors.” | | | | | | Steven L. Bietz | | 5354
| | Mr. Bietz was elected president and chief executive officer of WBI Holdings, Inc. effective March 4, 2006; president effective January 2, 2006; executive vice president and chief operating officer effective September 1, 2002; vice president-administration and chief accounting officer effective November 3, 1999; vice president-administration effective February 1997; and controller effective January 1994. | | | | | | William R. Connors | | 5051
| | Mr. Connors was elected vice president–renewable resources of MDU Resources Group, Inc., effective September 1, 2008. Prior to that, he was vice president-business development of Cascade Natural Gas Corporation effective November 2007; vice president-origination, contracts & regulatory of Centennial Energy Resources, LLC, effective January 2007; vice president-origination, contracts & regulatory of Centennial Power, Inc., effective July 2005; and, was first employed as vice president-contracts & regulatory of Centennial Power, Inc., effective July 2004. Prior to that Mr. Connors was of counsel to Miller Nash, LLP, a law firm in Seattle, Washington. | | | | | | Mark A. Del Vecchio | | 5253
| | Mr. Del Vecchio was elected vice president–human resources on October 1, 2007. From November 3, 2003 to October 1, 2007, Mr. Del Vecchio was director of executive programs and compensation. From April 1996 to October 31, 2003, Mr. Del Vecchio was vice president and member of The Carter Group, LLC, an executive search and management consulting company. | | | | | | David L. Goodin
| | 50
| | Mr. Goodin was elected president and chief executive officer of Montana-Dakota Utilities Co., Great Plains Natural Gas Co., and Cascade Natural Gas Corporation effective June 6, 2008, and president and chief executive officer of Intermountain Gas Company effective October 1, 2008. Prior to that, he was president of Montana-Dakota Utilities Co. and Great Plains Natural Gas Co. effective March 1, 2008; president of Cascade Natural Gas Corporation effective July 2, 2007; executive vice president-operations and acquisitions of Montana-Dakota Utilities Co. effective January 2007; vice president-operations effective January 2000; electric systems manager effective April 1999; electric systems supervisor effective August 1993; division electric superintendent effective February 1989; and division electrical engineer effective May 1983.
| | | | | | John G. Harp | | 5960
| | Mr. Harp was elected chief executive officer of Knife River Corporation effective January 1, 2012, and will continuecontinues to serve as chief executive officer of MDU Construction Services Group, Inc. He was elected president and chief executive officer of Utility Services Inc., which is now MDU Construction Services Group, Inc., effective September 29, 2004. From May 2004 to September 29, 2004, Mr. Harp was vice president of Ledcor Technical Services Inc., a provider of fiber optic cable maintenance services. From April 2001 to May 2004, he was president of JODE CORP., a broadband maintenance company. Mr. Harp sold JODE CORP. to Ledcor Construction in May 2004. Prior to that, he was president of Harp Line Constructors Co. and Harp Engineering, Inc. from July 1998, when they were bought by Utility Services Inc., to April 2001. | | | | | | Nicole A. Kivisto | | 3839
| | Ms. Kivisto was elected vice president, controller and chief accounting officer effective February 17, 2010. Prior to that she was controller effective December 1, 2005; a financial analyst IV in the Corporate Planning Department effective May 2003; a financial and investor relations analyst in the Investor Relations Department effective May 2000; and a financial analyst in the Corporate Accounting Department effective July 1995. | | | | | | Douglass A. Mahowald | | 6263
| | Mr. Mahowald was elected treasurer and assistant secretary effective February 17, 2010. Prior to that he was the assistant treasurer and assistant secretary effective August 1992; treasury services manager effective November 1982; and budget statistician effective February 1982. | | | | | | K. Frank Morehouse | | 54 | | Mr. Morehouse was elected president and chief executive officer of Montana-Dakota Utilities Co., Great Plains Natural Gas Co., Cascade Natural Gas Corporation, and Intermountain Gas Company effective January 4, 2013. Prior to that, he was executive vice president and general manager of Cascade Natural Gas Corporation effective April 1, 2009, and Intermountain Gas Company effective October 1, 2008; vice president-operations of Montana-Dakota Utilities Co. and Great Plains Natural Gas Co. effective January 29, 2007; Region Manager for Montana-Dakota Utilities Co. effective October 1, 2004; and Region Manager of Great Plains Natural Gas Co. when it was acquired July 1, 2000. | | | | | | Cynthia J. Norland | | 5758
| | Ms. Norland was elected vice president–administration effective July 16, 2007. Prior to that she was the assistant vice president–administration effective January 17, 2007; associate general counsel in the Legal Department effective March 6, 2004; and senior attorney in the Legal Department effective June 1, 1995. | | | | | | Paul K. Sandness | | 5758
| | Mr. Sandness was elected general counsel and secretary of the company, its divisions and major subsidiaries effective April 6, 2004. He also was elected a director of the company’s principal subsidiaries and was appointed to the Managing Committees of Montana-Dakota Utilities Co. and Great Plains Natural Gas Co. Prior to that he served as a senior attorney effective 1987 and as an assistant secretary of several subsidiary companies. |
| |
MDU Resources Group, Inc. Proxy Statement
|
49
|
| | | | | William E. Schneider | | 6364
| | Mr. Schneider was elected executive vice president–Bakken Development effective January 1, 2012. Prior to that, he was president and chief executive officer of Knife River Corporation effective May 1, 2005; and senior vice president-construction materials effective from September 15, 1999 to April 30, 2005. |
| | | | 56
| MDU Resources Group, Inc.Proxy Statement
|
| | | | | Doran N. Schwartz | | 4243
| | Mr. Schwartz was elected vice president and chief financial officer effective February 17, 2010. Prior to that, he was vice president and chief accounting officer effective March 1, 2006; and assistant vice president-special projects effective September 6, 2005. He was director of membership rewards for American Express, a financial services company, from November 2004 to August 1, 2005; audit manager for Deloitte & Touche, an audit and professional services company, from June 2002 to November 2004; and audit manager/senior for Arthur Andersen, an audit and professional services company, from December 1997 to June 2002. | | | | | | John P. Stumpf | | 5253
| | Mr. Stumpf was elected vice president–strategic planning effective December 1, 2006. Mr. Stumpf was vice president–corporate development for Knife River Corporation from July 1, 2002 to November 30, 2006, and director of corporate development of Knife River Corporation from January 14, 2002 to June 30, 2002. Prior to that, he was special projects manager for Knife River Corporation from May 1, 2000 to January 13, 2002. | | | | | | J. Kent Wells | | 5556
| | Mr. Wells was elected vice chairman of the company and a director effective January 4, 2013, and continues to serve as president and chief executive officer of Fidelity Exploration & Production Company, the position for which he was hired effective May 2, 2011. Prior to that he was senior vice presidentFor more information about Mr. Wells, see “Election of exploration and production for BP America, Inc. from June 2007 until October 2010, when he was named BP America Inc.’s group senior vice president for global deepwater response until March 31, 2011. He also served as general manager of Abu Dhabi Company for Onshore Oil Operations from February 2005 until June 2007; vice-president, Gulf of Mexico shelf, for BP America, Inc. from 2002 to 2005; vice-president, Rockies, for BP America, Inc. from 2000 to 2002; general manager of Crescendo Resources LP from 1997 to 2000; manager, Hugoton, for Amoco Production Company, Inc. from 1993 to 1996; manager, operations, for Amoco Production Company, Inc. in 1993; and resource manager for Amoco Production Company, Inc. in 1988 to 1993.Directors.” |
SECURITY OWNERSHIP
The table below sets forth the number of shares of our capital stock that each director and each nominee for director, each named executive officer, and all directors and executive officers as a group owned beneficially as of December 31, 2011.2012. | | | | | | | | | | | | | | | | | Common Shares Beneficially | | | | | Owned Include: | | | | | | | | | | | | | | Shares | | | | | Individuals | | Deferred | | | | | Have Rights | | Director Fees | | | | | Common Shares | | to Acquire | | Shares Held By | | Held as | | | | | Beneficially | | Within 60 | | Family | | Percent | | Phantom | | | | | | | | | | | | | | | Name | Name | | Owned(1) | | Days(2) | | Members(3) | | of Class | | Stock(4) | | | Common Shares
Beneficially
Owned(1) | | Shares Held By
Family
Members(2) | | Percent
of Class | | Deferred
Director Fees
Held as
Phantom
Stock(3) | | | Steven L. Bietz | | | 69,392 | (4) | | | | * | | | | Thomas Everist | Thomas Everist | | 1,880,123 | (5) | | 6,750 | | 1.0 | | 28,350 | | | 1,885,590 | (5) | | | | 1.0 | | 29,243 | | Karen B. Fagg | Karen B. Fagg | | 30,997 | | | | * | | | 37,481 | | | | * | | | | John G. Harp | | 85,719 | (6) | | | | * | | | Terry D. Hildestad | Terry D. Hildestad | | 214,073 | | | | * | | | 214,073 | | | | * | | | | A. Bart Holaday | A. Bart Holaday | | 35,012 | | | | * | | | 41,200 | | | | * | | | | Dennis W. Johnson | Dennis W. Johnson | | 81,019 | (7) | | 4,560 | | * | | | 88,583 | (6) | | 4,560 | | * | | | | Thomas C. Knudson | Thomas C. Knudson | | 19,000 | | | | * | | | 24,467 | | | | * | | | | Richard H. Lewis | Richard H. Lewis | | 25,700 | | | | * | | 16,275 | | | 28,167 | | | | * | | 18,185 | | Patricia L. Moss | Patricia L. Moss | | 56,687 | | | | | | * | | | 63,225 | | | | * | | | | Harry J. Pearce | Harry J. Pearce | | 212,550 | | | | * | | 46,614 | | | 218,017 | | | | * | | 48,081 | | William E. Schneider | William E. Schneider | | 116,219 | (8) | | 800 | | * | | | 104,555 | (7) | | 800 | | * | | | | Doran N. Schwartz | Doran N. Schwartz | | 18,735 | (6) | | | | | | * | | | 24,763 | (4) (8) | | 1,300 | | * | | | | J. Kent Wells | J. Kent Wells | | — | (9) | | | | | | * | | | 27,743 | | | | * | | | | John K. Wilson | John K. Wilson | | 82,439 | | | | | | * | | | 90,549 | | | | * | | | | All directors and executive officers as a group (23 in number) | All directors and executive officers as a group (23 in number) | | 3,124,888 | | 6,750 | | 18,006 | | 1.7 | | 91,239 | | | 3,222,078 | | 20,228 | | 1.7 | | 95,509 | |
| | * | Less than one percent of the class. | (1) | “Beneficial ownership” means the sole or shared power to vote, or to direct the voting of, a security, or investment power with respect to a security. | (2) | Indicates shares of our stock that executive officers and directors have the right to acquire within 60 days pursuant to stock options. These shares are included in the “Common Shares Beneficially Owned” column.
| (3) | These shares are included in the “Common Shares Beneficially Owned” column.
| (4)
| These shares are not included in the “Common Shares Beneficially Owned” column. Directors may defer all or a portion of their cash compensation pursuant to the Deferred Compensation Plan for Directors. Deferred amounts are held as phantom stock with dividend accruals and are paid out in cash over a five-year period after the director leaves the board. | (4) | Includes full shares allocated to the officer’s account in our 401(k) retirement plan. | (5) | Includes 1,820,000 shares of common stock acquired through the sale of Connolly-Pacific to us. | (6) | Includes full shares allocated to the officer’s account in our 401(k) retirement plan.
| (7)
| Mr. Johnson disclaims all beneficial ownership of the 4,560 shares owned by his wife. | (8)(7)
| Mr. Schneider disclaims all beneficial ownership of the 800 shares owned by his wife. | (9)(8)
| As of February 22, 2012,The total includes 1,300 shares owned by Mr. Wells owns 25,743 shares of our common stock.Schwartz’s wife.
|
| |
50
| |
MDU Resources Group, Inc.Proxy Statement
| 57
|
We prohibit our directors and executive officers from hedging their ownership of company common stock. They may not enter into transactions that allow them to benefit from devaluation of our stock or otherwise own stock technically but without the full benefits and risks of such ownership. Directors, executive officers, and related persons are prohibited from holding our common stock in a margin account, with certain exceptions, or pledging company securities as collateral for a loan. Company common stock may be held in a margin brokerage account only if the stock is explicitly excluded from any margin, pledge, or security provisions of the customer agreement. Company common stock may be held in a cash account, which is a brokerage account that does not allow any extension of credit on securities. “Related person” means an executive officer’s or director’s spouse, minor child, and any person (other than a tenant or domestic employee) sharing the household of a director or executive officer, as well as any entities over which a director or executive officer exercises control. The table below sets forth information with respect to any person we know to be the beneficial owner of more than five percent of any class of our voting securities. | | | | | | | | | | | Name and Address | | Amount and Nature | | Percent | | | | | | | | | Title of Class | | of Beneficial Owner | | of Beneficial Ownership | | of Class | | | Name and Address
of Beneficial Owner | | Amount and Nature
of Beneficial Ownership | | Percent of
Class | | Common Stock | | | BlackRock, Inc.
40 East 52nd Street
New York, NY 10022 | | 11,808,063 | (1) | 6.25 | % | | | | | | | | | | Common Stock | | New York Life Trust Company | | | T. Rowe Price Associates, Inc.
100 E. Pratt Street
Baltimore, MD 21202 | | 11,315,091 | (2) | 5.90 | % | | | 51 Madison Avenue | | | | | | | | | | New York, NY 10010 | | 9,676,893 | (1) | 5.13 | % | | Common Stock | | | State Street Corporation
State Street Financial Center
One Lincoln Street
Boston, MA 02111 | | 9,760,389 | (3) | 5.20 | % | | | | | | | | | | | | | Common Stock | | BlackRock, Inc. | | | | | | | The Vanguard Group
100 Vanguard Blvd.
Malvern, PA 19355 | | 10,319,105 | (4) | 5.46 | % | | | 40 East 52nd Street | | | | | | | | | New York, NY 10022 | | 10,780,367 | (2) | 5.71 | % | | | | | | | | | Common Stock | | T. Rowe Price Associates, Inc. | | | | | | | | | 100 E. Pratt Street | | | | | | | | | Baltimore, MD 21202 | | 11,783,757 | (3) | 6.20 | % | | | | |
| | (1) | In a Schedule 13G/A, Amendment No. 12,3, filed on February 14, 2012, New York Life Trust Company indicates that it holds these shares as directed trustee of our 401(k) plan and has sole voting and dispositive power with respect to all shares. | (2)
| In a Schedule 13G/A, Amendment No. 2, filed on February 13, 2012,5, 2013, BlackRock, Inc. reports sole voting and dispositive power with respect to all shares as the parent holding company or control person of BlackRock Capital Management, BlackRock Financial Management, Inc., BlackRock Japan Co. Ltd., BlackRock Advisors (UK) Limited, BlackRock Institutional Trust Company, N.A., BlackRock Fund Advisors, BlackRock Asset Management Canada Limited, BlackRock Asset Management Australia Limited, BlackRock Advisors, LLC, BlackRock Investment Management, LLC, BlackRock Investment Management (Australia) Limited, BlackRock Life Limited, BlackRock (Netherlands) B.V., BlackRock Fund Managers Limited, BlackRock Asset Management Ireland Limited, BlackRock International Limited, and BlackRock Investment Management (UK) Limited.
| (3)(2)
| In a Schedule 13G,13G/A, Amendment No. 1, filed on February 14, 2012,7, 2013, T. Rowe Price Associates, Inc. reports sole voting power with respect to 2,372,9401,724,000 shares and sole dispositive power with respect to 11,783,75711,315,091 shares. These securities are owned by individual and institutional investors to which T. Rowe Price serves as investment adviser with power to direct investments and/or sole power to vote the securities. For purposes of the reporting requirements of the Securities Exchange Act of 1934, T. Rowe Price is deemed to be a beneficial owner of such securities; however, T. Rowe Price expressly disclaims that it is, in fact, the beneficial owner of such securities. | (3) | In a Schedule 13G, filed on February 12, 2013, State Street Corporation reports shared voting and dispositive power with respect to all shares as the parent holding company or control person of State Street Global Advisors France S.A., State Street Bank and Trust Company, SSGA Funds Management, Inc., State Street Global Advisors Limited, State Street Global Advisors Ltd, State Street Global Advisors, Australia Limited, State Street Global Advisors Japan Co., Ltd. and State Street Global Advisors, Asia Limited. | (4) | In a Schedule 13G, filed on February 13, 2013, The Vanguard Group reports sole dispositive power with respect to 10,140,265 shares, shared dispositive power with respect to 178,840 shares and sole voting power with respect to 191,340 shares. These shares include 127,440 shares beneficially owned by Vanguard Fiduciary Trust Company, a wholly-owned subsidiary of The Vanguard Group, Inc., as a result of its serving as investment manager of collective trust accounts, and 115,300 shares beneficially owned by Vanguard Investments Australia, Ltd., a wholly-owned subsidiary of The Vanguard Group, Inc., as a result of its serving as investment manager of Australian investment offerings. |
| |
MDU Resources Group, Inc. Proxy Statement
|
51
|
RELATED PERSON TRANSACTION DISCLOSURE
The board of directors has adopted a policy for the review of related person transactions. This policy is contained in our corporate governance guidelines, which are posted on our website at www.mdu.com. The audit committee reviews related person transactions in which we are or will be a participant to determine if they are in the best interests of our stockholders and the company. Financial transactions, arrangements, relationships, or any series of similar transactions, arrangements, or relationships in which a related person had or will have a material interest and that exceed $120,000 are subject to the committee’s review. Related persons are directors, director nominees, executive officers, holders of 5% or more of our voting stock, and their immediate family members. Immediate family members are spouses, parents, stepparents, mothers-in-law, fathers-in-law, siblings, brothers-in-law, sisters-in-law, children, stepchildren, daughters-in-law, sons-in-law, and any person, other than a tenant or domestic employee, who shares the household of a director, director nominee, executive officer, or holder of 5% or more of our voting stock. After its review, the committee makes a determination or a recommendation to the board and officers of the company with respect to the related person transaction. Upon receipt of the committee’s recommendation, the board of directors or officers, as the case may be, take such action as they deem appropriate in light of their responsibilities under applicable laws and regulations. The audit committee and the board of directors reviewed two leases between an indirect subsidiary of the company and a Nevada limited liability company, MOJO Montana, LLC (MOJO). John G. Harp, who was president andis chief executive officer of MDU Construction Services Group, Inc. until January 1, 2012, at which time he became the chief executive officer of MDU Construction Services Group, Inc.,and Knife River Corporation, and his brother, Michael D. Harp, are managing members of MOJO. The properties described in these two leases are located in Kalispell and Billings, Montana, and have been leased since 1998. In May 2010, the audit committee determined that renewing these leases was in the company’s best interests after it reviewed 2010 third party appraisals for the properties and considered the consumer price index and our operating companies’ knowledge of local property markets. The audit committee recommended and the board approved three-year leases for these properties that provide for our indirect subsidiary to pay a combined monthly rent of $9,508 to MOJO. The leases expire June 30, 2013. CORPORATE GOVERNANCE Director Independence
The board of directors has adopted guidelines on director independence that are included in our corporate governance guidelines, which are available for review on our corporate website at http://www.mdu.com/Documents/Governance/CorporateGovernance.pdf. The board of directors has determined that Thomas Everist, Karen B. Fagg, A. Bart Holaday, Dennis W. Johnson, Thomas C. Knudson, Richard H. Lewis, Patricia L. Moss, Harry J. Pearce, and John K. Wilson: | | • | have no material relationship with us and | | | • | are independent in accordance with our director independence guidelines and the New York Stock Exchange listing standards. |
| | | | 58
| MDU Resources Group, Inc.Proxy Statement
|
In determining director independence for 2011,In determining director independence for 2012, the board of directors considered the following transactions or relationships:
| | • | Mr. Everist’s ownership of approximately 1.86 million shares in 2010 and approximately 1.87 million shares in 2011 and approximately 1.89 million shares in 2012 of our common stock. In December 2011, we entered into a two-year contract with WebFilings, LLC, which offers a cloud-based solution for meeting SEC reporting requirements. The contract provides for a quarterly subscription fee of approximately $13,000 to use WebFilings’ software and for additional fees to be determined based on the number of users and additional services requested. The additional fees for 2011 were $4,500, for 2012 were $5,000, and we expect them to be approximately $3,100 for 2013. Mr. Everist is a limited partner and owns less than 1% of WebFilings, LLC. The MDU Resources Foundation (Foundation) made charitable contributions to Medcenter One Foundation, which is now known as Sanford Health following a merger effective July 2, 2012, in the amount of $500 in 2011 and $1,250 in 2012. Mr. Everist is a member of the board of directors of the Sanford Health Foundation and his wife, Barbara Everist, is vice chairman of the board of trustees of Sanford Health. | | | • | charitable contributions from the Foundation in the amount of $13,500 in 2010 and $33,625$2,700 in 2011 to the Montana State University – Ms. Fagg serves as a member of the Montana State University’s Engineering Advisory Council | | | •
| charitable contributionsand $2,625 in the amount of $14,750 in 2010 and $2,700 in 20112012 to the University of North Dakota Foundation – Mr. Holaday serves as the Chairmanchairman of the Boardboard and as a Trusteetrustee for the University of North Dakota Center for Innovation Foundation and also serves as a director for the University of North Dakota Foundation; charitable contributions from the Foundation in the amount of $1,250 in 2010 and $3,750 in 2011 and $27,250 in 2012 to Jamestown College or its foundation – Mr. Holaday serves as a directortrustee for Jamestown CollegeCollege.
| | | • | charitable contributions from the Foundation to the City of Dickinson in the amount of $20,000 in 20102011 and in 20112012 – Mr. Johnson is president of the City of Dickinson board of commissionerscommissioners. | | |
| | | 52 | MDU Resources Group, Inc. Proxy Statement |
| | • | charitable contributions from the Foundation to Colorado UpLift in the amount of $25,000 in 20102011 and $20,000 in 2011–2012 – Mr. Lewis is a board director and chairman of the Development Board of Colorado UpLift; charitable contributions from the Foundation in the amount of $10,000 in 20102011 and $5,000 in 20112012 to the Alliance for Choice in Education – Mr. Lewis serves on the Colorado Board of Trustees for Alliance. |
Director Resignation upon Change of Job Responsibility
Our corporate governance guidelines require a director to tender his or her resignation after a material change in job responsibility. In 2011, two2012, no directors submitted resignations under this requirement. Ms. Fagg submitted her resignation in connection with the announcement of her retirement as vice president of DOWL LLC, d/b/a DOWL HKM, effective December 31, 2011. Ms. Moss submitted her resignation in connection with her retirement from Cascade Bancorp and the Bank of the Cascades effective July 25, 2012. After considering the background, experience on the board, skills and character, and contribution to the company by both of these directors in light of the company’s business and structure, the board determined the resignations should not be accepted. Code of Conduct
We have a code of conduct and ethics, which we refer to as the Leading With Integrity Guide, which applies to all employees, directors, and officers. | | We intend to satisfy our disclosure obligations regarding: | | • | amendments to, or waivers of, any provision of the code of conduct that applies to our principal executive officer, principal financial officer, and principal accounting officer and that relates to any element of the code of ethics definition in Regulation S-K, Item 406(b) and | | | • | waivers of the code of conduct for our directors or executive officers, as required by New York Stock Exchange listing standards by posting such information on our website at http://www.mdu.com/Documents/Governance/IntegrityGuide.pdf. |
Board Leadership Structure and Board’s Role in Risk Oversight
The board separated the positions of chairman of the board and chief executive officer in 2006 and elected Harry J. Pearce, a non-employee independent director, as our chairman, and Terry D. Hildestad as our president and chief executive officer.chairman. Separating these positions allows our chief executive officer to focus on the full-time job of running our business, while allowing the chairman of the board to lead the board in its fundamental role of providing advice to and independent oversight of management. The board believes this structure recognizes the time, effort, and energy that the chief executive officer is required to devote to his position in the current business environment, as well as the commitment required to serve as our chairman, particularly as the board’s oversight responsibilities continue to grow and demand more time and attention. The fundamental role of the board of directors is to provide oversight of the management of the company in good faith and in the best interests of the company and its stockholders. Having an independent chairman is a means to ensure the chief executive officer is accountable for managing the company in close alignment with the interests of stockholders. An independent chairman avoids the conflicts of interest that arise when the chairman and chief executive positions are combined and more effectively manages relationships between the board and the chief executive officer. An independent chairman is in a better position to encourage frank and lively discussions and to assure that the company has adequately assessed all appropriate business risks before adopting its final business plans and strategies. WhileIn August 2012, we amended our bylaws and corporate governance guidelines do notto require that our chairman and chief executive officer positions be separate, theindependent. The board continues to believebelieves that having separate positions and having an independent outside director serve as chairman is the appropriate leadership structure for the company and demonstrates our commitment to good corporate governance. | | | | MDU Resources Group, Inc.Proxy Statement
| 59
|
Risk is inherent with every business, and how well a business manages risk can ultimately determine its success. We face a number of risks, including economic risks, environmental and regulatory risks, and others, such as the impact of competition, weather conditions, limitations on our ability to pay dividends, increased pension plan obligations, and cyber attacks or acts of terrorism. Management is responsible for the day-to-day management of risks the company faces, while the board, as a whole and through its committees, has responsibility for the oversight of risk management. In its risk oversight role, the board of directors has the responsibility to satisfy itself that the risk management processes designed and implemented by management are adequate and functioning as designed. The board believes that establishing the right “tone at the top” and that full and open communication between management and the board of directors are essential for effective risk management and oversight. Our chairman meets regularly with our president and chief executive officer and other senior officers to discuss strategy and risks facing the company. Senior management attends the quarterly board meetings and is available to address any questions or concerns raised by the board on risk management-related and any other matters. Each quarter, the board of directors receives presentations from senior management on strategic matters involving our operations. The board holds strategic planning sessions with senior management to discuss strategies, key challenges, and risks and opportunities for the company. While the board is ultimately responsible for risk oversight at our company, our three board committees assist the board in fulfilling its oversight responsibilities in certain areas of risk. The audit committee assists the board in fulfilling its oversight responsibilities with respect to risk assessment and management in a general manner and specifically in the areas of financial reporting, internal controls and | | | MDU Resources Group, Inc. Proxy Statement | 53 |
compliance with legal and regulatory requirements, and, in accordance with New York Stock Exchange requirements, discusses policies with respect to risk assessment and risk management and their adequacy and effectiveness. Risk assessment reports are regularly provided by management to the audit committee. This opens the opportunity for discussions about areas where the company may have material risk exposure, steps taken to manage those exposures, and the company’s risk tolerance in relation to company strategy. The audit committee reports regularly to the board of directors on the company’s management of risks in the audit committees’committee’s areas of responsibility. The compensation committee assists the board in fulfilling its oversight responsibilities with respect to the management of risks arising from our compensation policies and programs. The nominating and governance committee assists the board in fulfilling its oversight responsibilities with respect to the management of risks associated with board organization, membership and structure, succession planning for our directors and executive officers, and corporate governance. Board Meetings and Committees
During 2011,2012, the board of directors held fourseven meetings. Each incumbent director attended at least 75% of the combined total meetings of the board and the committees on which the director served during 2011.2012. Director attendance at our annual meeting of stockholders is left to the discretion of each director. Three directors attended our 20112012 annual meeting of stockholders. Harry J. Pearce was elected non-employee chairman of the board on August 17, 2006. Mr. Pearce served as lead director from February 15, 2001 to August 17, 2006. He presides at the executive session of the non-employee directors held in connection with each regularly scheduled quarterly board of directors meeting. The non-employee directors also meet in executive session with the chief executive officer at each regularly scheduled quarterly board of directors meeting. All of our non-employee directors are independent directors. The board has a standing audit committee, compensation committee, and nominating and governance committee. These committees are composed entirely of independent directors. The audit, compensation, and nominating and governance committees have charters, which are available for review on our website at http://www.mdu.com/Governance/Pages/BoardChartersandCommittees.aspx. Our corporate governance guidelines are available at http://www.mdu.com/Documents/Governance/CorporateGovernance.pdf, and our Leading With Integrity Guide is also on our website at http://www.mdu.com/Documents/Governance/IntegrityGuide.pdf. Nominating and Governance Committee
The nominating and governance committee met threefour times during 2011.2012. The committee members were Karen B. Fagg, chairman, Richard H. Lewis, A. Bart Holaday, and Patricia L. Moss, who joined the committee effective May 12, 2011.Moss. | | The nominating and governance committee provides recommendations to the board with respect to: | | • | board organization, membership, and function | | | • | committee structure and membership | | | • | succession planning for our executive management and directors and | | | • | corporate governance guidelines applicable to us. |
| | | | 60
| MDU Resources Group, Inc.Proxy Statement
|
The nominating and governance committee assists the board in overseeing the management of risks in the committee’s areas of responsibility. The committee identifies individuals qualified to become directors and recommends to the board the nominees for director for the next annual meeting of stockholders. The committee also identifies and recommends to the board individuals qualified to become our principal officers and the nominees for membership on each board committee. The committee oversees the evaluation of the board and management. In identifying nominees for director, the committee consults with board members, our management, consultants, and other individuals likely to possess an understanding of our business and knowledge concerning suitable director candidates. | | | 54 | MDU Resources Group, Inc. Proxy Statement |
Our corporate governance guidelines include our policy on consideration of director candidates recommended to us. We will consider candidates that our stockholders recommend. Stockholders may submit director candidate recommendations to the nominating and governance committee chairman in care of the secretary at MDU Resources Group, Inc., P.O. Box 5650, Bismarck, ND 58506-5650. Please include the following information: | | • | the candidate’s name, age, business address, residence address, and telephone number | | | • | the candidate’s principal occupation | | | • | the class and number of shares of our stock owned by the candidate | | | • | a description of the candidate’s qualifications to be a director | | | • | whether the candidate would be an independent director and | | | • | any other information you believe is relevant with respect to the recommendation. |
These guidelines provide information to stockholders who wish to recommend candidates for director for consideration by the nominating and governance committee. Stockholders who wish to actually nominate persons for election to our board at an annual meeting of stockholders must follow the procedures set forth in section 2.08 of our bylaws. You may obtain a copy of the bylaws by writing to the secretary of MDU Resources Group, Inc. at the address above. Our bylaws are also available on our website at http://www.mdu.com/Documents/Governance/2011-11_Bylaws.pdf.Pages/CorporateGovernanceGuidelines.aspx. See also the section entitled “2013“2014 Annual Meeting of Stockholders” later in the proxy statement. There are no differences in the manner by which the committee evaluates director candidates recommended by stockholders and those recommended by other sources. | | In evaluating director candidates, the committee considers an individual’s: | | • | background, character, and experience, including experience relative to our company’s lines of business | | | • | skills and experience which complement the skills and experience of current board members | | | • | success in the individual’s chosen field of endeavor | | | • | skill in the areas of accounting and financial management, banking, general management, human resources, marketing, operations, public affairs, law, technology, and operations abroad | | | • | background in publicly traded companies | | | • | geographic area of residence | | | • | diversity of business and professional experience, skills, gender, and ethnic background, as appropriate in light of the current composition and needs of the board | | | • | independence, including affiliationsany affiliation or relationshipsrelationship with other groups, organizations, or entities and | | | • | prior and future compliance with applicable law and all applicable corporate governance, code of conduct and ethics, conflict of interest, corporate opportunities, confidentiality, stock ownership and trading policies, and our other policies and guidelines. |
As indicated above, when identifying nominees to serve as director, the nominating and governance committee will consider candidates with diverse business and professional experience, skills, gender, and ethnic background, as appropriate, in light of the current composition and needs of the board. The nominating and governance committee assesses the effectiveness of this policy annually in connection with the nomination of directors for election at the annual meeting of stockholders. The composition of the current board reflects diversity in business and professional experience, skills, and gender. | | | | MDU Resources Group, Inc.Proxy Statement
| 61
|
The committee generally will hire an outside firm to perform a background check on potential nominees. | | | MDU Resources Group, Inc. Proxy Statement | 55 |
Audit Committee
The audit committee is a separately-designated standing committee established in accordance with Section 3(a)(58)(A) of the Securities Exchange Act of 1934. The audit committee met eight times during 2011.2012. The audit committee members are Dennis W. Johnson, chairman, A. Bart Holaday, Richard H. Lewis, and John K. Wilson. The board of directors has determined that Messrs. Johnson, Holaday, Lewis, and Wilson are “audit committee financial experts” as defined by Securities and Exchange Commission regulations and Messrs. Johnson, Holaday, Lewis, and Wilson meet the independence standard for audit committee members under our director independence guidelines and the New York Stock Exchange listing standards, including the Securities and Exchange Commission’s audit committee member independence requirements. The audit committee assists the board of directors in fulfilling its oversight responsibilities to the stockholders and serves as a communication link among the board, management, the independent auditors, and the internal auditors. The audit committee: | | | • | assists the board’s oversight of | | | | | o○
| the integrity of our financial statements and system of internal controls | | | | | o○
| our compliance with legal and regulatory requirements | | | | | o○
| the independent auditors’ qualifications and independence | | | | | o○
| the performance of our internal audit function and independent auditors and | | | | | o○
| risk management in the audit committee’s areas of responsibility and | | | | • | arranges for the preparation of and approves the report that Securities and Exchange Commission rules require we include in our annual proxy statement. |
Audit Committee Report
| | | | | | | In connection with our financial statements for the year ended December 31, 2011,2012, the audit committee has (1) reviewed and discussed the audited financial statements with management; (2) discussed with the independent auditors the matters required to be discussed by the statement on Auditing Standards No. 61, as amended, (AICPA,Professional Standards, Vol. 1, AU section 380), as adopted by the Public Company Accounting Oversight Board in Rule 3200T; (3) received the written disclosures and the letter from the independent accountant required by applicable requirements of the Public Company Accounting Oversight Board regarding the independent accountant’s communications with the audit committee concerning independence, and has discussed with the independent accountant the independent accountant’s independence. | | | | | | | | Based on the review and discussions referred to in items (1) through (3) of the above paragraph, the audit committee recommended to the board of directors that the audited financial statements be included in our Annual Report on Form 10-K for the year ended December 31, 2011,2012, for filing with the Securities and Exchange Commission. | | | | | | | | Dennis W. Johnson, Chairman | | | | A. Bart Holaday | | | | Richard H. Lewis | | | | John K. Wilson |
| | | | 6256
| MDU Resources Group, Inc.Proxy Statement |
| Proxy Statement
Statement | |
CompensationCommittee
The compensation committee metcommitteemet five times during 2011.2012. The compensation committee members are Thomas Everist, chairman, Karen B. Fagg, Thomas C. Knudson, and Patricia L. Moss. The compensation committee’s responsibilities, as set forthsetforth in its charter, include: | | • | review andreviewand recommend changes to the board regarding our executive compensation policies for directors and executives
| | | • | evaluate theevaluatethe chief executive officer’s performance and, either as a committee or together with other independent directors as directed by the board, determine his or her compensation
| | | • | recommend to the board the compensation of our other Section 16 officers and directors | | | • | establish goals, make awards, review performance and determine, or recommend to the board, awards earned under our annual and long-term incentive compensation plans | | | • | review and discuss with management the compensation discussion and analysis and based upon such review and discussion, determine whether to recommend to the board that the Compensation Discussion and Analysis be included in our proxy statement and/or our Annual Report on Form 10-K | | | • | arrange for the preparation of and approve the compensation committee report to be included in our proxy statement and/or Annual Report on Form 10-K and | | | • | assist the board in overseeing the management of risk in the committee’s areas of responsibility. |
The compensation committee andcommitteeand the board of directors have sole and direct responsibility for determining compensation for our Section 16 officers and directors. The compensation committee makes recommendations to the board regarding compensation of all Section 16 officers, and the board then approves the recommendations. The compensation committee and the board may not delegate their authority. They may, however, use recommendations from outside consultants, the chief executive officer, and the human resources department. The chiefThechief executive officer, the vice president-human resources, and general counsel regularly attend compensation committee meetings. The committee meets in executive session as needed. The committee’s practice has been to retain a compensation consultant every other year to conduct a competitive analysis on executive compensation. The committee did not retainretained a compensation consultant in 20112012 to prepare a competitive assessment for 2012 compensation.2013 compensation for our Section 16 officers. We discuss ourdiscussour processes and procedures for consideration and determination of compensation of our Section 16 officers in the Compensation Discussion and Analysis. We also discuss in the Compensation Discussion and Analysis the role of our executive officers in determining or recommending compensation for our Section 16 officers. The board of directors determines compensation for our non-employee directors based upon recommendations fromDuring2012, the compensation committee. The committee’s practice has beencommittee retained Towers Watson to retain a compensation consultant every other year to conduct a competitive analysis on director compensation.
During 2011,prepare the vice president-human resources and the human resources department prepared the2013 competitive assessment covering our Section 16 officers. In an engagement letter dated March 23, 2012, the compensation committee asked Towers Watson to prepare separate executive compensation reviews for 2012 compensationthe Section 16 officers and for our executive officers. The vice president-human resources and the human resources department also worked with the chief executive officer. In its review for the Section 16 officers, excluding the chief executive officer, Towers Watson was asked to:
| | • | recommend salary grades,match the Section 16 officer positions to survey data to generate 2013 market estimates for base salaries and annualshort-term and long-term incentive targets for our executive officersincentives
| | | • | reviewaddress general trendsin executive compensation
| | | • | compare base salariesand target short-term and long-term incentives, by position, to market estimates and recommend salary grade changes as appropriate | | | • | construct a recommended base2013 salary grades, salary increases, and annualgrade structure | | | • | verify the competitiveness of short-term and long-term incentive targets submitted by executive officers for officers reporting to them for reasonablenessassociated with salary grades and alignment with company or business unit objectivesrecommend modifications as appropriate. |
| | | | | MDU Resources Group, Inc.Proxy Statement | 57 |
In the chief executive officer review, Towers Watson was asked to use survey data and data from the company’s performance graph peer group to: | | • | develop competitive estimatesfor base salary and target short-term and long-term incentives | | | • | recommend changes in base salary and incentive targets based on the competitive data and | | | • | review and update annual and long-term incentive programs.address general trendsin chief executive officer compensation.
|
As discussed in the Compensation Discussion and Analysis, at the request of Mr. Hildestad, the human resources department conducted a competitive assessment in January 2011 to determine the compensation level necessary to recruit a qualified individual to lead Fidelity Exploration & Production Company. Mr. Hildestad, with the assistance of our vice president-human resources, negotiated Mr. Wells’ compensation in connection with his hiring.
The compensation committee has sole authority toauthorityto retain, discharge, and approve fees and other terms and conditions for retention of compensation consultants to assist in consideration of the compensation of the chief executive officer, the other Section 16 officers, and the board of directors. The compensation committee charter requires the committee’s pre-approval of the engagement of the committee’s compensation consultants by the company for any other purpose. | | | | MDU Resources Group, Inc.Proxy Statement
| 63
|
In an engagement letter dated February 28, 2011, and signed by the chairman of the compensation committee, the compensation committee retained Towers Watson to prepare a review of competitive compensation for our non-employee directors’ compensation, including a separate comparison of the non-executive chairman, for review at the committee’s May 2011 meeting.
In its review of board of director compensation, Towers Watson was asked to:
| | •
| analyze results and develop a competitive director pay reference point using our former and new performance graph peer groups and
| | | •
| identify market trends relative to director compensation, including whether there are any trends to pay equity using a fixed dollar value.
|
The results of the Towers Watson analysis showed the company’s level of total direct compensation, which is annual board retainer plus equity, was below the medians of both peer groups at the 28th percentile of its current performance graph peer group and at the 23rd percentile of its former performance graph peer group. Additional retainers for the audit, compensation, and nominating and governance committee chairs were well below the medians of both of the performance graph peer groups. In terms of the level of non-executive chairman compensation, the company’s level of total direct compensation was well below the medians compared to the companies in our performance graph peer groups that had a non-executive chairman. The company’s non-executive chairman was at the 31st percentile when compared to companies with a non-executive chairman in the current peer group and at the 17th percentile when compared to the companies with non-executive chairmen in the former peer group. After review and discussion of Towers Watson’s report, the board determined to increase the committee chairmen’s retainers by $5,000 and to change the annual stock grant from a fixed number of shares to a grant of shares equal in value to $110,000. No changes were made to the compensation of the company’s non-executive chairman.
The compensation committee also authorized the company to participate in compensation and employee benefits surveys sponsored by Towers Watson during 2011.in 2012. The compensation committee requestedand received information from its compensation consultant, Towers Watson, to assist the committee in determining whether Towers Watson’s work raised any conflict of interest. The compensation committee has reviewed Towers Watson’s responses to its request and determined that the work of Towers Watson did not raise any conflict of interest in 2012. The boardof directors determines compensation for our non-employee directors based upon recommendations from the compensation committee. The compensation committee’s practice has been to retain a compensation consultant every other year to conduct a competitive analysis on director compensation. The compensation committee did not retain an outside consultant for the 2012 compensation review for the board of directors. At its May 2012 meeting, the committee reviewed the analysis of competitive data and recent trends in director compensation, including independent chairman of the board compensation, prepared by the human resources department and the vice president-human resources. The company’s analysis was based on proxy data from our performance graph peer group companies compiled by Equilar and on data from the National Association of Corporate Directors 2011/2012 Director Compensation Report. The committee compared the data to our directors’ compensation and each of its components. After review and discussion of the market data, which indicated that our median director compensation of $165,000 was below the median total direct compensation of$179,596 for large companies in the National Association of Corporate Directors 2011/2012 Director Compensation Report and consistent with the median total direct compensation of $162,002 of the peer companies, the compensation committee recommended, and the board approved, that no changes be made to director compensation for 2012. With respect to non-executive chairman of the board compensation comparison to other directors, the multiple of the median non-executive director total pay for the company was 1.45X as compared to 1.64X under the National Association of Corporate Directors 2011/2012 Director Compensation Report companies and 1.84X for the peer companies. The compensation committee recommended, and the board approved, that no changes be made to the non-executive chairman of the board compensation for 2012. Stockholder Communications
Stockholders and other interested parties who wish to contact the board of directors or an individual director, including our non-employee chairman or non-employee directors as a group, should address a communication in care of the secretary at MDU Resources Group, Inc., P.O. Box 5650, Bismarck, ND 58506-5650. The secretary will forward all communications. SECTION 16(a) BENEFICIAL OWNERSHIP REPORTING COMPLIANCE
Section 16 Section16 of the Securities Exchange Act of 1934, as amended, requires that officers, directors, and holders of more than 10% of our common stock file reports of their trading in our equity securities with the Securities and Exchange Commission. Based solely on a review of Forms 3, 4, and 5 and any amendments to these forms furnished to us during and with respect to 20112012 or written representations that no Forms 5 were required, we believe that all such reports were timely filed.filed, except that one Form 4 for Mr. Lewis reporting one transaction was filed one week late. CONDUCT OF MEETING;ADJOURNMENT The chairman of the board has broad responsibility and authority to conduct the annual meeting in an orderly and timely manner. In addition, our bylaws provide that the meeting may be adjourned from time to time by the chairman of the meeting regardless of whether a quorum is present.
| | | | | 58 | MDU Resources Group, Inc. Proxy Statement |
OTHER BUSINESS
Neither the board of directors nor management intends to bring before the meeting any business other than the matters referred to in the notice of annual meeting and this proxy statement. We have not been informed that any other matter will be presented at the meeting by others. However, if any other matter requiring a vote ofmatters are properly brought before the stockholders should arise,annual meeting, or any adjournment(s) thereof, your proxies include discretionary authority for the persons named in the enclosed proxy willto vote or act on such matters in accordance with their best judgment.discretion. SHAREDSHARED ADDRESS STOCKHOLDERS
In accordance with a notice sent to eligible stockholders who share a single address, we are sending only one annual report to stockholders and one proxy statement to that address unless we received instructions to the contrary from any stockholder at that address. This practice, known as “householding,” is designed to reduce our printing and postage costs. However, if a stockholder of record wishes to receive a separate annual report to stockholders and proxy statement in the future, he or she may contact the office of the treasurer at MDU Resources Group, Inc., P.O. Box 5650, Bismarck, ND 58506-5650, Telephone Number: (701) 530-1000. Eligible stockholders of record who receive multiple copies of our annual report to stockholders and proxy statement can request householding by contacting us in the same manner. Stockholders who own shares through a bank, broker, or other nominee can request householding by contacting the nominee.
We hereby undertake to deliver promptly, upon written or oral request, a separate copy of the annual report to stockholders and proxy statement to a stockholder at a shared address to which a single copy of the document was delivered.
| | | | 64
| MDU Resources Group, Inc.Proxy Statement
|
20132014 ANNUAL MEETING OF STOCKHOLDERS
Director Nominations:Our bylaws provide thatprovidethat director nominations may be made only by (i) the board at any meeting of stockholders or (ii) at an annual meeting by a stockholder entitled to vote for the election of directors and who has complied with the procedures established by the bylaws. For a nomination to be properly brought before an annual meeting by a stockholder, the stockholder intending to make the nomination must have given timely and proper notice of the nomination in writing to the corporate secretary in accordance with and containing all information and the completed questionnaire provided for in the bylaws. To be timely, such notice must be delivered to or mailed to the corporate secretary and received at our principal executive offices not later than 90 days prior to the first anniversary of the preceding year’s annual meeting of stockholders. For purposes of our annual meeting of stockholders expected to be held April 23, 2013,22, 2014, any stockholder who wishes to submit a nomination must submit the required notice to the corporate secretary on or before January 24, 2013.23, 2014. Other Meeting Business:Our bylaws also provide thatprovidethat no business may be brought before an annual meeting except (i) as specified in the meeting notice given by or at the direction of the board, (ii) as otherwise properly brought before the meeting by or at the direction of the board or (iii) properly brought before the meeting by a stockholder entitled to vote who has complied with the procedures established by the bylaws. For business to be properly brought before an annual meeting by a stockholder (other than nomination of a person for election as a director which is described above) the stockholder must have given timely and proper notice of such business in writing to the corporate secretary, in accordance with, and containing all information provided for in the bylaws and such business must be a proper matter for stockholder action under the General Corporation Law of Delaware. To be timely, such notice must be delivered or mailed to the corporate secretary and received at our principal executive offices not later than the close of business 90 days prior to the first anniversary of the preceding year’s annual meeting of stockholders. For purposes of our annual meeting expected to be held April 23, 2013,22, 2014, any stockholder who wishes to bring business before the meeting (other than nomination of a person for election as a director which is described above) must submit the required notice to the corporate secretary on or before January 24, 2013.23, 2014. Discretionary Voting:Rule 14a-4Rule14a-4 of the Securities and Exchange Commission’s proxy rules allows us to use discretionary voting authority to vote on matters coming before an annual stockholders’ meeting if we do not have notice of the matter at least 45 days before the anniversary date on which we first mailed our proxy materials for the prior year’s annual stockholders’ meeting or the date specified by an advance notice provision in our bylaws. Our bylaws contain an advance notice provision that we have described above. For our annual meeting of stockholders expected to be held on April 23, 2013,22, 2014, stockholders must submit such written notice to the corporate secretary on or before January 24, 2013.23, 2014. | | | | | MDU Resources Group, Inc.Proxy Statement | 59 |
Stockholder Proposals:The requirements we describe above are separate from and in addition to the Securities and Exchange Commission’s requirements that a stockholder must meet to have a stockholder proposal included in our proxy statement under Rule 14a-8 of the Exchange Act. For purposes of our annual meeting of stockholders expected to be held on April 23, 2013,22, 2014, any stockholder who wishes to submit a proposal for inclusion in our proxy materials must submit such proposal to the corporate secretary on or before November 9, 2012.13, 2013. Bylaw Copies:You may obtain aobtaina copy of the full text of the bylaw provisions discussed above by writing to the corporate secretary. Our bylaws are also available on our website at: http://www.mdu.com/Documents/Governance/2011-11_Bylaws.pdf.Pages/CorporateGovernanceGuidelines.aspx. We will make available to our stockholders to whom we furnish this proxy statementa copy of our Annual Report on Form 10-K, excluding exhibits, for the year ended December 31, 2011,2012, which is required to be filed with the Securities and Exchange Commission. You may obtain a copy, without charge, upon written or oral request to the Office of the Treasurer of MDU Resources Group, Inc., 1200 West Century Avenue, Mailing Address: P.O. Box5650, Bismarck, ND 58506-5650, Telephone Number: (701) 530-1000. You may also access our Annual Report on Form 10-K through our website at www.mdu.com.www.mdu.com. | | | By order of the Board of Directors, | | | |  
| | | | Paul K.PaulK. Sandness
| | Secretary | | March 9, 2012
|
| | | | MDU Resources Group, Inc.Proxy StatementMarch 13, 2013
| 65
|
(This page has been left blank intentionally.)
| | | | | 6660
| MDU Resources Group, Inc.Proxy Statement |
| | | | | EXHIBIT A | | | | | | | | | | Towers Perrin’s (Towers Watson)Watson 2010 | | Auto Club GroupAvanade
| | Chiquita BrandsCH Energy Group
| 2009 General Industry Executive
| | Automatic Data Processing
| | Choice Hotels International
| Compensation Database
| | Avery Dennison
| | Chrysler
| | | Avis Budget Group | | CHSCH2M Hill
| Compensation Database | | Avista | | CIGNAChemtura
| 3M
| | Avon Products
| | CIT Group
| 7-Eleven
| | AXA EquitableGroup | | CITGO PetroleumChevron
| A&P
| | B&W Technical Services Y-12 | | City National BankChevron Phillips Chemical
| A.O. Smith
| | BAE Systems
| | Cleco
| A. T. Cross3M
| | Ball | | CNAChiquita Brands
| AAA of Science7-Eleven
| | Bank of America | | CobankChoice Hotels International
| Abbott LaboratoriesA&P
| | Bank of Hawaii | | CHS | A.H. Belo | | Bank of New York Mellon | | CIGNA | A.O. Smith | | Bank of the West | | Cimarex Energy | A. T. Cross | | Barnes Group | | Cintas | AAA Northern California, Nevada & Utah | | Barrick Gold of North America | | Coca-Cola EnterprisesCisco Systems
| ABC
| | Battelle Memorial Institute
| | Colgate-Palmolive
| AccentureAAA of Science
| | Baxter International | | Colorado Springs UtilitiesCIT Group
| ACH FoodAbbott Laboratories
| | Bayer AG | | Columbia SportswearCleco
| Advance PublicationsABC
| | Bayer CropScience | | Comcast Cable CommunicationsCliffs Natural Resources
| Advanced Micro DevicesAccenture
| | Bayer MaterialScience | | CMS Energy | ACH Food | | BB&T | | ComericaCNA
| Advanstar CommunicationsAcuity Brands
| | BBVA | | COACH | AEGON | | BD | | Cobank | AEI Services | | Beckman Coulter | | Commerce InsuranceCoca-Cola
| Aegon USAAeropostale
| | Belo | | CommScopeColgate-Palmolive
| AEI ServicesAFLAC
| | Benjamin MooreBemis
| | Compass BancsharesColorado Springs Utilities
| AerojetAgilent Technologies
| | Best Buy | | CompuCom SystemsColumbia Sportswear
| AeropostaleAgrium
| | BG US Services | | ConAgra FoodsComcast
| AFLACAIG
| | Big Lots | | ConnellComerica
| Agilent TechnologiesAir Liquide
| | Bill & Melinda Gates Foundation | | Commerce Bancshares | Air Products and Chemicals | | Biogen Idec | | ConocoPhillipsCommerce Insurance
| AGL ResourcesAlcatel-Lucent
| | Bio-Rad LaboratoriesBJ’s Wholesale Club
| | Consolidated EdisonConAgra Foods
| Agrium U.S.Alcoa
| | Black Hills Power and Light | | Connell Limited Partnership | Alcon Laboratories | | Blockbuster | | Constellation EnergyConocoPhillips
| AIGAlexander & Baldwin
| | Blue Cross Blue Shield of Florida | | Consumers EnergyConseco
| Air Products and Chemicals
| | Blue Shield of California
| | Consumers Union
| Alcatel-LucentAllegheny Energy
| | Blyth | | Continental AirlinesConsolidated Edison
| Alcoa
| | Bob Evans Farms
| | Continental Automotive Systems
| Allegheny EnergyAllergan
| | Boehringer Ingelheim | | ContinentalConstellation Energy Systems
| AllerganAllete
| | Boeing | | ConvaTecConsumers Union
| AlleteAlliant Energy
| | BOK Financial | | Convergys
| Alliance DataContinental Automotive Systems
| | Booz Allen Hamilton
| | Covance
| Alliant EnergyTechsystems | | Boston Scientific | | CovidienConvaTec
| Allianz | | Bovis Lend Lease | | Cox EnterprisesConvergys
| Allstate | | BP | | CPS EnergyCooper Industries
| Amazon.comAllured Business Media
| | Brady | | Crown CastleCorning
| AmerenAmazon.com
| | Bremer Financial | | CSRCovance
| American Airlines
| | Bright Business Media
| | CSX
| American Chemical SocietyAmeren
| | Bristol-Myers Squibb | | CubicCovanta Holdings
| American Chemical Society | | Broadcom | | Covidien | American Crystal Sugar | | Brown-FormanBurlington Northern Santa Fe
| | Curtiss-WrightCox Enterprises
| American Electric Power | | Bush Brothers | | CVS CaremarkCPS Energy
| American Express | | C.H. Robinson Worldwide | | Cracker Barrel Old Country Stores | American Family Insurance | | CA | | Daiichi SankyoCrown Castle
| American Family InsuranceUnited Life | | Cablevision Systems | | Daimler Trucks North America
| American United Life
| | CACI International
| | DanaCrump Group
| American Water Works | | Cadbury North AmericaCabot
| | DannonCSR
| AMERIGROUPAmeriprise Financial
| | Cadbury | | CSX | Ameritrade | | Calgon Carbon | | DCP MidstreamCUNA Mutual
| Ameriprise FinancialAmeron
| | California Independent System Operator | | Dean FoodsCVS Caremark
| AmeritradeAMETEK
| | Callaway Golf | | Deere & CompanyCytec
| AmeronAmgen
| | Calpine | | Delta AirlinesDaiichi Sankyo
| AMETEKAnadarko Petroleum
| | Cameron International | | DeluxeDana
| AmgenAnn Taylor Stores
| | Capital One Financial | | Denny’sDannon
| AmwayAOL
| | Capitol Broadcasting – WRAL | | DentsplyDarden Restaurants
| Anadarko PetroleumAPL
| | Cardinal Health | | Devon EnergyDay & Zimmermann
| APLAppleton Papers
| | Career Education | | DCP Midstream | Applied Materials | | CareFusion | | Dean Foods | ARAMARK | | Cargill | | Diageo North AmericaDel Monte Foods
| Apollo GroupArcher Daniels Midland
| | Carlson Companies | | DIRECTVDell
| Applied MaterialsArctic Cat
| | Carmeuse Lime & StoneCarnival
| | Dominion ResourcesDelta Air Lines
| ARAMARKAreva
| | Carpenter Technology | | DonaldsonDeluxe
| Areva NPArmstrong World Industries
| | Catalent Pharma Solutions | | Dow Chemical
| Armstrong World Industries
| | Caterpillar
| | Dow JonesDenny’s
| Arrow Electronics | | Catholic Healthcare West | | DPLDentsply
| ArvinMeritor
| | CDI
| | Dr Pepper Snapple
| Arysta LifeScience North AmericaAstraZeneca
| | Cedar Rapids TV – KCRG | | DukeDevon Energy
| Ascend Media
| | Celestica
| | DuPont
| Associated Banc-CorpAT&T
| | Celgene | | DynegyDevry
| AstraZenecaATC Management
| | Cemex | | Dex One | Atmos Energy | | CenterPoint Energy | | E*Trade
| AT&T
| | Century Aluminum
| | E.ON U.S.
| ATC Management
| | Cephaon
| | E.W. Scripps
| Atmos Energy
| | CH2M Hill
| | Eastman Chemical
| Atos Origin
| | Chevron
| | Eastman KodakDiageo North America
| Aurora Healthcare | | Chicago Mercantile ExchangeCenturyLink
| | EatonDionex
| Auto Club Group | | Cephalon | | Direct Energy | Automatic Data Processing | | CF Industries | | Disney Publishing Worldwide |
| | | | MDU Resources Group, Inc.Proxy Statement | A-1 |
| | | | | eBayDominion Resources
| | FPL Group | | HR Access | Domtar | | Franklin Resources | | HSBC Holdings | Donaldson | | Freddie Mac | | Hubbard Broadcasting | Dow Chemical | | Freedom Communications | | Humana | Dow Corning | | Freeport-McMoRan Copper & Gold | | Hunt Consolidated | Dow Jones | | Future US | | Huntington Bancshares | DPL | | GAF Materials | | Huntsman | DTE Energy | | Gannett | | Husky Injection Molding Systems | Duke Energy | | Gap | | Hyatt Hotels | DuPont | | GATX | | IBM | E.ON U.S. | | Gavilon | | Integrys Energy GroupIDACORP
| EcolabE.W. Scripps
| | GDF SUEZ Energy North America | | IntelIDEXX Laboratories
| Edison International
| | Genentech
| | Intercontinental Hotels
| Education ManagementEastman Chemical
| | General Atomics | | IKON Office Solutions | Eaton | | General Dynamics | | IMS Health | Ecolab | | General Electric | | Independence Blue Cross | Edison International Data | | General Mills | | Infragistics | Education Management | | General Motors | | ING | Eisai | | General DynamicsGenworth Financial
| | Integrys Energy Group | El Paso Corporation | | Genzyme | | Intel | Electric Power Research Institute | | Getty Images | | Intercontinental Hotels | Eli Lilly | | Gilead Sciences | | International Data | EMC | | GlaxoSmithKline | | International Flavors & Fragrances | El Paso CorporationEMCOR Group
| | General Electric
| | International Game Technology
| Electric Power Research Institute
| | General MillsGMAC Financial Services
| | International Paper | Eli Lilly
| | General Motors
| | Invensys Controls
| Embarq
| | GenTek
| | Invensys Process Systems
| Embraer
| | Genworth Financial
| | Irvine Company
| EMC
| | Genzyme
| | Irwin Financial
| EMCOR Group
| | GEO Group
| | ISO New England
| EMI Music
| | Getty Images
| | J. Crew
| Emulex
| | Gilead Sciences
| | J.C. Penney Company
| Enbridge Energy
| | GlaxoSmithKline
| | J.M. Smucker
| Endo PharmaceuticalsEmergency Medical Services
| | Goodrich | | J.R. SimplotInvensys Controls
| EnergenEMI Music
| | Goodyear Tire & Rubber | | Jack in the BoxION Geophysical
| Enbridge Energy | | Google | | Iron Mountain | Energen | | Gorton’s | | Irvine Company | Energy Future Holdings | | GoogleGraco
| | Jacobs EngineeringIrving Oil Commercial G.P
| Energy Northwest | | Gorton’s
| | Jarden
| Entergy
| | Great-West Life Annuity | | JetBlueISO New England
| EPCOEntergy
| | Greif | | JM FamilyiSoft
| EPCO | | Gruma | | ISP | Epson | | Grupo Ferrovial | | ITT – Corporate | Equifax | | GS1 USGSM Association
| | John HancockJ. Crew
| Equity Office Properties | | GTECH | | Johns-ManvilleJ.C. Penney Company
| ERCOT | | Guardian Life | | Johnson & JohnsonJ.M. Smucker
| Erie Insurance | | Guideposts | | Johnson ControlsJ.R. Simplot
| Ernst & Young | | GXS | | Kaiser Foundation Health PlanJabil Circuit
| ESRIESPN
| | H&R Block | | Jack in the Box | Essilor of America | | H.B. Fuller | | Kaman Industrial TechnologiesJacobs Engineering
| Evening Post Publishing – KOAA | | H.J. Heinz | | JM Family | Evergreen Packaging | | Hanesbrands | | Kansas City SouthernJohn Hancock
| Evergreen PackagingEvonik Degussa
| | Hannaford | | KB HomeJohnson & Johnson
| Exelon | | Harland Clarke | | KBRJohnson Controls
| ExterranExpress Scripts
| | Harley-Davidson | | KCTS TelevisionJournal Broadcast Group
| ExxonMobilExterran
| | Harman International IndustriesHarris Bank
| | KelloggKaiser Foundation Health Plan
| F & W MediaExxonMobil
| | Harris Enterprises | | Kelly ServicesKalmbach Publishing
| Fairchild ControlsFair Isaac
| | Harry Winston | | Kerry Ingredients & FlavoursKaman Industrial Technologies
| Fannie MaeFairchild Controls
| | Hartford Financial Services | | KeyCorpKao Brands
| FANUC Robotics America | | Hasbro | | KBR | Farmers Group | | Hawaiian Electric | | Kimberly-Clark
| Farm Progress Companies
| | Hayes Lemmerz
| | Kimco Realty
| Federal Home Loan Bank of Pittsburgh
| | HBO
| | Kindred HealthcareKellogg
| Federal Home Loan Bank of San Francisco | | HBO | | KeyCorp | Federal Reserve Bank of Atlanta | | HCA Healthcare | | Kinross GoldKimberly-Clark
| Federal Reserve Bank of Cleveland | | Health Care ServicesHD Supply
| | KiplingerKinder Morgan
| Federal Reserve Bank of Dallas | | Health Net | | KLA-Tencor
| Federal Reserve Bank of New York
| | Healthways
| | KnightKindred Healthcare
| Federal Reserve Bank of Philadelphia | | HearstHealthways
| | Koch IndustriesKing Pharmaceuticals
| Federal Reserve Bank of San Francisco | | Hearst-Argyle TelevisionHenkel of America
| | KohlerKinross Gold
| Federal Reserve Bank of St. Louis | | Henkel of America
| | Kohl’s
| Ferderal-Mogul
| | Henry Ford Health Systems | | KPMGKLA-Tencor
| FerrellgasFerderal-Mogul
| | Herman Miller | | L.L. BeanKnowles Electronics
| Fidelity InvestmentsFerrellgas
| | Hershey | | L-3 CommunicationsKoch Industries
| Fidelity Investments | | Hertz | | Kohler | Fidelity National Information Services | | Hess | | Kohl’s | Fifth Third Bancorp | | HertzHewlett-Packard
| | Lafarge North AmericaKPMG
| Fireman’s Fund Insurance | | HessHighmark Blue Cross Blue Shield
| | Land O’LakesL.L. Bean
| First AmericanHorizon National | | Hexion Specialty ChemicalsHilton Worldwide
| | Leggett and PlattL-3 Communications
| First DataSolar | | Hitachi Data Systems | | LenovoLafarge North America
| First Horizon NationalFirstEnergy
| | HNI | | Level 3 CommunicationsLance
| First SolarFiserv
| | HNTB | | Lexmark InternationalLand O’Lakes
| FirstEnergyFisher Communications
| | Hoffmann-La Roche | | Liberty MutualLanxess
| FiservFlowserve
| | Home Shopping Network | | Laureate Education | Fluor | | Honeywell | | Life TechnologiesLear
| FluorFord
| | Horizon LinesBlue Cross Blue Shield of New | | Life TouchLeggett and Platt
| FMA CommunicationsForest Laboratories
| | Jersey | | LES | Fortune Brands | | Hormel Foods | | Limited
| Ford
| | Hospira
| | Lincoln Financial
| Forest Laboratories
| | Houghton Mifflin
| | Lockheed Martin
| Fortune Brands
| | Hovnanian Enterprises
| | LoewsLevel 3 Communications
| Forum Communications – WDAY | | HSBC North AmericaHospira
| | LOMALevi Strauss
| FPLFox Networks Group
| | Hubbard BroadcastingHoughton Mifflin Harcourt Publishing
| | Lorillard Tobacco
| Franklin Resources
| | Humana
| | Lower Colorado River Authority
| Freddie Mac
| | Hunt Consolidated
| | M&T Bank
| Freedom Communications
| | Huntington Bancshares
| | Magellan Midstream Partners
| Freeport-McMoRan Copper & Gold
| | Hyatt Hotels
| | Marathon Oil
| Frontier Airlines
| | IBM
| | Marriott International
| G&K Services
| | IDACORP
| | Marshall & Ilsley
| GAF Materials
| | Idearc Media
| | Martin Marietta Materials
| Gannett
| | IDEXX Laboratories
| | Mary Kay
| Gap
| | IKON Office Solutions
| | Masco
| Garland Power & Light
| | IMS Health
| | MassachusettsLiberty Mutual
| Garmin
| | ING
| | Mattel
| GATX
| | Ingersoll-Rand
| | Matthews International
|
| | | | A-2 | MDU Resources Group, Inc.Proxy Statement |
| | | | | Life Technologies | | New York Times | | Praxair | Lincoln Financial | | New York University | | Premera Blue Cross | Lockheed Martin | | Newmont Mining | | Principal Financial | Loews | | NewPage | | PrivateBancorp | LOMA | | Nicor | | Progress Energy | Lorillard Tobacco | | Nielsen Expositions | | Progressive Corporation | Lower Colorado River Authority | | NIKE | | Proliance Energy | LPL Financial | | Nissan North America | | Protective Life | Lyondell Chemical | | Nokia | | Providence Health & Services | M&T Bank | | Noranda Aluminum | | Prudential Financial | MAG Industrial Automation Systems | | Norfolk Southern | | Public Service Enterprise Group | Magellan Midstream Partners | | Northeast Utilities | | Puget Energy | Marathon Oil | | Northern Power Systems | | Pulte Homes | Marriott International | | Northrop Grumman | | Purdue Pharma | Marsh & McLennan | | Northstar Travel Media | | QUALCOMM | Marshall & Ilsley | | NorthWestern Energy | | Quest Diagnostics | Martin Marietta Materials | | Northwestern Mutual | | Quintiles | Mary Kay | | NOVA Chemicals | | R.R. Donnelley | Masco | | Novartis | | Ralcorp Holdings | Massachusetts Mutual | | Novartis Consumer Health | | Razorfish | MasterCard | | Novell | | RBC – US | Mattel | | Novo Nordisk Pharmaceuticals | | Reader’s Digest | Matthews International | | NRG Energy | | Realogy | McClatchy | | NSTAR | | Redcats USA | McDermott | | NV Energy | | Reddy Ice | McDonald’s | | NW Natural | | Redknee Solutions | McGraw-Hill | | NXP Semi-Conductor | | Reed Business | McKesson | | Nycomed US | | Regency Energy Partners LP | MDU Resources | | Nypro | | Regions Financial | MeadWestvaco | | Occidental Chemical | | Research in Motion | Mecklenburg County | | Occidental Petroleum | | Revlon | Media General | | Office Depot | | RF Micro Devices | Media Tec Publishing | | OGE Energy | | RGA Reinsurance Group | Medicines Company | | Oglethorpe Power | | Rio Tinto | MedImmune | | Oklahoma Today Magazine | | Roche Diagnostics | Medtronic | | Omaha Public Power | | Rockwell Automation | Merck & Co | | Omgeo | | Rockwell Collins | Meredith | | OneBeacon Insurance | | Rodale Press | MetLife | | Open Text USA | | RRI Energy | Microsoft | | Orange Business Services | | Ryder System | Midwest Independent | | Oshkosh Truck | | S.C. Johnson | McDermott
| | Otter Tail
| | Safety-Kleen Systems
| McDonald’sTransmission System Operator
| | Owens Corning | | SAICSafety-Kleen Systems
| McKessonMilacron
| | Owens-Illinois | | Salt River ProjectSAIC
| MDU ResourcesMillennium Inorganic Chemicals
| | Pacific Gas & Electric | | Sanmina-SCISalt River Project
| MeadWestvacoMillipore
| | Pacific Life | | SanDisk | Mine Safety Appliances | | Parametric Technology | | Sanofi Pasteur | Medco Health SolutionsMirant
| | Panasonic of North AmericaParker Hannifin
| | Sanofi-Aventis | Media GeneralMizuno USA
| | Papa John’sParsons
| | Sara LeeSantee Cooper
| Media Tec PublishingMolson Coors Brewing
| | Parametric TechnologyPearson
| | Sarkes Tarzian – KTVN | MedImmuneMolycorp Minerals
| | Parker HannifinPennWell
| | Sarkes Tarzian – WRCB | MedtronicMoneyGram International
| | ParsonsPenton Media
| | SAS Institute | Meister Media Worldwide
| | Pearson Education
| | Savannah River Nuclear Solutions
| Merck & CoMonsanto
| | People’s Bank | | SCA AmericasSaturday Evening Post
| MeredithMoody’s
| | Pepco Holdings | | SCANA
| Metavante Technologies
| | PepsiCo
| | Schering-Plough
| MetLife
| | Perot Systems
| | Schlumberger
| MetroPCS Communications
| | PetSmart
| | Schneider Electric
| MGE Energy
| | Pfizer
| | School Specialty
| Microsoft
| | Philips Helathcare
| | Schreiber Foods
| Midwest Independent Transmission System
| | Phillips-Van Heusen
| | Schurz – KYTV
| Operator
| | Phoenix Companies
| | Schurz – WDBJ
| Millennium Pharmaceuticals
| | PhRMA
| | Schwan’s
| Millipore
| | Pinnacle West Captial
| | Scripps Networks Interactive
| Mine Safety Appliances
| | Pioneer Hi-Bred International
| | Seagate Technology
| Mirant
| | Pitney Bowes
| | Sealed Air
| Molson Coors Brewing
| | Pittsburgh Corning
| | Securian Financial Group
| MoneyGram International
| | PJM Interconnection
| | Securitas Security Services USASaudi Arabian Oil
| Morgan Murphy Stations – WISC | | PepsiCo | | Savannah River Nuclear Solutions | Mosaic | | PerkinElmer | | Savannah River Remediation | Motorola | | Pervasive Software | | SCA Americas | Munich Re Group | | PetSmart | | SCANA | Murphy Oil | | Pfizer | | Schlumberger | MWH Global | | Phillips-Van Heusen | | School Specialty | Nash-Finch | | Phoenix Companies | | Schreiber Foods | Nation | | Pinnacle West Capital | | Schurz – KYTV | National Geographic Society | | Pitney Bowes | | Schurz – WDBJ | National Renewable Energy Laboratory | | Pittsburgh Corning | | Schwan’s | National Starch Polymers Group | | PJM Interconnection | | Scripps Networks Interactive | Nationwide | | PlainsCapital | | Security Benefit GroupSeagate Technology
| MosaicNavistar International
| | Plexus | | Sempra EnergySealed Air
| Motorola
| | PMI Group
| | Sensata Technologies
| MSC Industrial DirectNavy Federal Credit Union
| | PNC Financial Services | | Shell OilSecurian Financial Group
| Munich Reinsurance AmericaNaylor
| | PNM Resources | | Sherwin-WilliamsSecurity Benefit Group
| National Renewable Energy LaboratoryNBC Universal
| | Polaris Industries | | Shire PharmaceuticalsSempra Energy
| NationwideNCCI Holdings
| | Polymer Group | | SiemensSensata Technologies
| Navistar InternationalNestle USA
| | PolyOne | | Sinclair Broadcast GroupSensient Technologies
| Navy Federal Credit UnionNetJets
| | Portland General Electric | | Sirius XM RadioShell Oil
| NBC UniversalNew York Independent System Operator
| | Potash | | SLMSherwin-Williams
| NCCI HoldingsNew York Life
| | PPG Industries | | Smurfit-Stone Container
| NCR
| | PPL
| | Sodexo USA
| Neoris USA
| | Praxair
| | Sonoco Products
| Nestle USA
| | Principal Financial
| | Sony Corporation of America
| New York Life
| | Progress Energy
| | South Financial GroupShire Pharmaceuticals
| New York Power Authority | | ProgressivePPL
| | Southern Company Services
| New York Times
| | Providence Health & Services
| | Southern Union Company
| New York University
| | Prudential Financial
| | Southwest Airlines
| Newmont Mining
| | Public Service Enterprise Group
| | Southwest Power Pool
| NewPage
| | Puget Energy
| | Sovereign Bancorp
| Nicor
| | Pulte Homes
| | Spectra Energey
| NIKE
| | Purdue Pharma
| | Sprint Nextel
| Nokia
| | QUALCOMM
| | SPX
| Noranda Aluminum
| | Quest Diagnostics
| | Stanford University
| Norfolk Southern
| | Quintiles
| | Stantec
| Northeast Utilities
| | Qwest Communications
| | Staples
| Northern Trust
| | R.H. Donnelley
| | Starbucks
| NorthWestern Energy
| | R.R. Donnelley
| | Starwood Hotels & Resorts
| Northwestern Mutual
| | Ralcorp Holdings
| | State Farm Insurance
| Novartis
| | Rayonier
| | State Street
| Novartis Consumer Health
| | Raytheon
| | Steelcase
| Novell
| | RBC Dain Rauscher
| | Sterling Bancshares
| Novo Nordisk Pharmaceuticals
| | Reader’s Digest
| | STP Nuclear Operating
| NRG Energy
| | Reed Business Information
| | String Letter Publishing
| NSTAR
| | Reed Exhibitions
| | Summit Business Media
| NuStar Energy
| | Regal-Beloit
| | Sun Life Financial
| NV Energy
| | Regency Energy Partners LP
| | Sun Microsystems
| NW Natural
| | Regions Financial
| | Sundt Construction
| NXP Semi-Conductor
| | Reliant Energy
| | Sunoco
| Nycomed US
| | Research in Motion
| | SunTrust Banks
| Occidental Petroleum
| | RF Micro Devices
| | Target
| Office Depot
| | RGA Reinsurance Group of America
| | Taubman Centers
| OGE Energy
| | Rio Tinto
| | Taunton Press
| Oglethorpe Power
| | Robb Report
| | Taylor-Wharton International
| Omaha Public Power
| | Roche Diagnostics
| | TD Banknorth
| Omnova Solutions
| | Rockwell Automation
| | TECO Energy
| OneBeacon Insurance
| | Rockwell Collins
| | TeleTech Holdings
| Orange Business Services
| | Rolls-Royce North America
| | TellabsSiemens
|
| | | | MDU Resources Group, Inc.Proxy Statement | A-3 |
| | | | | Temple-InlandSimpson Manufacturing
| | Wells FargoTrinity Industries
| | Garland Power & LightTowers Watson 2010 Energy
| Tenet HealthcareSinclair Broadcast Group
| | Wendy’s/Arby’sTronox
| | Industry Executive | Sirius XM Radio | | TRW Automotive | | Compensation Database | Skype | | T-Systems | | | SLM | | TUI | | | Smith & Nephew | | Tupperware | | AEI Services | Smurfit-Stone Container | | Twin Cities Public Television – TPT | | Allegheny Energy | Snap-on | | Tyco Electronics | | Allete | Sodexo | | U.S. Bancorp | | Alliant Energy | Solutia | | U.S. Foodservice | | Ameren | Solvay America | | UIL Holdings | | American Electric Power | Sonoco Products | | Unifi | | Areva | Sony Corporation | | Unilever United States | | ATC Management | SourceMedia | | Union Bank of California | | Atmos Energy | Southern Company Services | | Union Pacific | | Avista | Southern Maryland Electric Cooperative | | UniSource Energy | | BG US Services | Southern Union Company | | Unisys | | Black Hills Power and Light | Southwest Power Pool | | United Airlines | | California Independent System Operator | Spectra Energy | | United Parcel Service | | Calpine | Spirit AeroSystems | | United Rentals | | CenterPoint Energy | Sprint Nextel | | United States Cellular | | CH Energy Group | SPX | | United States Steel | | Cleco | SRA International | | United Technologies | | CMS Energy | Stanford University | | United Water | | Colorado Springs Utilities | Stantec | | UnitedHealth | | Consolidated Edison | Starbucks | | Unitil | | Constellation Energy | StarTek | | University of Texas – | | Covanta Holdings | Starwood Hotels & Resorts | | M.D. Anderson Cancer Center | | CPS Energy | State Farm Insurance | | Unum Group | | DCP Midstream | State Street | | USAA | | Direct Energy | Steelcase | | USG | | Dominion Resources | Sterling Bancshares | | Valero Energy | | DPL | Stop & Shop | | Vectren | | DTE Energy | STP Nuclear Operating | | Verde Realty | | Duke Energy | Stryker | | Verizon | | E.ON U.S. | Sun Life Financial | | Vertex Pharmaceuticals | | Edison International | SunTrust | | VF | | El Paso Corporation | Sunflower Broadcasting | | Viacom | | Electric Power Research Institute | Sunoco | | Village Farms | | Enbridge Energy | Sunrise Senior Living | | Visa | | Energen | SuperMedia | | Vision Service Plan | | Energy Future Holdings | Swagelok | | Vistar | | Energy Northwest | Sybron Dental Specialties | | Visteon | | Entergy | Synacor | | Volvo Group North America | | EPCO | Takeda Pharmaceutical Company Limited | | Vulcan | | ERCOT | Targa Resources | | Vulcan Materials | | Exelon | Target | | VWR International | | First Solar | Taubman Centers | | Walt Disney | | FirstEnergy | TD Bank Financial Group | | Warnaco | | FPL Group | Telefonica O2 | | Washington Post | | GDF SUEZ Energy North America | TeradataTellabs
| | Westar EnergyWaste Management
| | Hawaiian Electric | TerexTemple-Inland
| | Western DigitalWatson Pharmaceuticals
| | IDACORP | Terra IndustriesTenet Healthcare
| | Western UnionWatts Water Technologies
| | Integrys Energy Group | TesoroTennessee Valley Authority
| | Westinghouse ElectricWebster Bank
| | ISO New England | TextronTeradata
| | WeyerhaeuserWellcare Health Plans
| | KnightKinder Morgan
| Thomas & BettsTerex
| | WhirlpoolWellpoint
| | LES | Tesoro | | Wells Fargo | | Lower Colorado River Authority | Thomas PublishingTexas Petrochemicals
| | Whole Foods MarketWendy’s/Arby’s Group
| | MDU Resources | Thrivent Financial for LutheransTextron
| | Williams Companies
| | MGEWestar Energy
| TIAA-CREF
| | Williams-Sonoma
| | Midwest Independent Transmission System | TimeThermo Fisher Scientific
| | Winn-Dixie StoresWestern Digital
| | System Operator
| Time WarnerThomas & Betts
| | Wisconsin EnergyWestinghouse Electric
| | Mirant | Time Warner CableThomas Publishing
| | Wm. Wrigley Jr.Weyerhaeuser
| | New York Independent System Operator | TimexThomson Reuters
| | Wolters Kluwer USWhirlpool
| | New York Power Authority | T-Mobile USAThrivent Financial for Lutherans
| | WPPWhole Foods Market
| | Nicor | ToroTIAA-CREF
| | Wisconsin Energy | | Northeast Utilities | Time | | Wm. Wrigley Jr. | | NorthWestern Energy | Time Warner | | Wolters Kluwer | | NRG Energy | Time Warner Cable | | Wray Edwin – KTBS | | Northeast UtilitiesNSTAR
| TransCanada
| | Wyeth Pharmaceuticals
| | NorthWestern Energy
| TransUnionTimken
| | Wyndham Worldwide | | NRGNV Energy
| TravelersT-Mobile USA
| | Xcel Energy | | NSTARNW Natural
| Tribune
| | Xerox
| | NV Energy
| TUI TravelToro
| | Yahoo! | | NW NaturalOGE Energy
| TupperwareTotal System Services
| | Young Broadcasting – KFLY
| | OGE Energy
| Twin Cities Public Television – TPT
| | Young Broadcasting – KRONYankee Publishing
| | Oglethorpe Power | Tyco ElectronicsTransCanada
| | Yum! BrandsYRC Worldwide
| | Omaha Public Power | U.S. BancorpTransUnion
| | Zale
| | Otter Tail
| U.S. Foodservice
| | Zurich North AmericaYum! Brands
| | Pacific Gas & Electric | UC4 SoftwareTravelers
| | Zale | | Pepco Holdings | UIL Holdings
| | | | Pinnacle West Capital
| Unilever United States
| | Towers Perrin’s (Towers Watson)
| | PJM Interconnection
| Union Bank of California
| | 2009 Energy Industry Executive
| | PNM Resources
| Union Pacific
| | Compensation Database
| | Portland General Electric
| UniSource Energy
| | | | PPL
| Unisys
| | AEI Services
| | Progress Energy
| United Airlines
| | AGL Resources
| | Public Service Enterprise Group
| United Rentals
| | Allegheny Energy
| | Puget Energy
| United States Cellular
| | Allete
| | Regency Energy Partners LP
| United States Enrichment
| | Alliant Energy
| | Reliant Energy
| United States Steel
| | Ameren
| | Salt River Project
| United Technologies
| | American Electric Power
| | SCANA
| United Water
| | Areva NP
| | Sempra Energy
| UnitedHealth
| | ATC Management
| | Southern Company Services
| Unitil
| | Atmos Energy
| | Southern Union Company
| Univar
| | Avista
| | Southwest Power Pool
| Universal Studios Orlando
| | BG US Services
| | Spectra Energy
| University of Texas – M.D. Anderson
| | Black Hills Power and Light
| | STP Nuclear Operating
| Cancer Center
| | California Independent System Operator
| | TECO Energy
| Unum Group
| | Calpine
| | Tennessee Valley Authority
| US Airways
| | CenterPoint Energy
| | TransCanada
| USAA
| | Cleco
| | UIL Holdings
| USG
| | CMS Energy
| | UniSource Energy
| Valero Energy
| | Colorado Springs Utilities
| | Unitil
| Verizon
| | Consolidated Edison
| | Westar Energy
| Vertex Pharmaceuticals
| | Constellation Energy
| | Westinghouse Electric
| VF
| | CPS Energy
| | Williams Companies
| Viacom
| | DCP Midstream
| | Wisconsin Energy
| Viad
| | Dominion Resources
| | Wolf Creek Nuclear
| Virgin Mobile USA
| | DPL
| | Xcel Energy
| Visa USA
| | Duke Energy
| | | Visiting Nurse Service
| | Dynegy
| | | Visteon
| | E.ON U.S.
| | Effective Compensation, Inc.’s
| Volvo Group North America
| | Edison International
| | 2009 Oil & Gas Compensation
| Vulcan
| | El Paso Corporation
| | Survey
| Vulcan Materials
| | Electric Power Research Institute
| | | VWR International
| | Enbridge Energy
| | Aera Energy Services Company
| W.R. Grace
| | Energen
| | Altex Energy Corporation
| W.W. Grainger
| | Energy Future Holdings
| | ANKOR Energy LLC
| Wachovia
| | Energy Northwest
| | Antero Resources Corporation
| Walt Disney
| | Entergy
| | Approach Resources Inc.
| Warnaco
| | EPCO
| | Aramco Services Company
| Waste Management
| | ERCOT
| | Aspect Energy, LLC
| Watson Pharmaceuticals
| | Exelon
| | Atlas Energy Resources L.L.C.F
| Webster Bank
| | FirstEnergy
| | Berry Petroleum Company
| Wellcare Health Plans
| | FPL Group
| | Bill Barrett Corporation
| Wellpoint
| | | | |
| | | | A-4 | MDU Resources Group, Inc.Proxy Statement |
| | | | | Pinnacle West Capital
PJM Interconnection
PNM Resources
Portland General Electric
PPL
Progress Energy
Proliance Holdings
Public Service Enterprise Group
Puget Energy
Regency Energy Partners LP
RRI Energy
Salt River Project
Santee Cooper
SCANA
Sempra Energy
Southern Company Services
Southern Maryland Electric Cooperative
Southern Union Company
Southwest Power Pool
Spectra Energy
STP Nuclear Operating
Targa Resources
Tennessee Valley Authority
TransCanada
UIL Holdings
UniSource Energy
Unitil
Vectren
Westar Energy
Westinghouse Electric
Wisconsin Energy
Wolf Creek Nuclear
Xcel Energy
Effective Compensation, Inc.’s
2010 Oil & Gas
Compensation Survey
ANKOR Energy LLC
Antero Resources
Approach Resources Inc.
Aspect Holdings, LLC
Atinum E&P, Inc.
Atlas Energy Resources L.L.C.F
Berry Petroleum Company
Bill Barrett Corporation
Black Hills Corporation
BOPCO, L.P.
BreitBurn Energy Partners LP
Brigham Exploration Company
Browning Oil Company, Inc.
BTA Oil Producers, LLC
Cabot Oil & ProductionGas Corporation
Cano Petroleum, Inc.
Carrizo Oil & Gas Inc.
Ceja Corporation
Chaparral Energy, L.L.C.
Chesapeake Energy Corporation
Cimarex Energy Co.
Comstock Resources
Cohort Energy Company (J-W Operating)
Concho Resources, Inc.
Consol Energy Inc.
Continental Resources, Inc.
Crimson Exploration, Inc.
Denbury Resources, Incorporated
Devon Energy Corporation
Duncan Oil, Inc.
Dynamic Offshore Resources, LLC
Eagle Rock Energy
EnCana Oil & Gas
Energen Resources Corporation
Energy Partners, Ltd.
Eni Petroleum Co. Inc. | | EOG Resources Inc
EQT Corporation
Equal Energy US Inc. (Altex Energy)
EXCO Resources, Inc.
Fasken Oil and Ranch, Ltd.
Fidelity Exploration & Production
FIML Natural Resources
Forest Oil Corporation
GMX Resources Inc.
Goodrich Petroleum Company of Louisiana
Great Western Drilling Company
Harvest Natural Resources, Inc.
Henry Resources LLC
HighMount Exploration & Production, LLC
Hilcorp Energy Company
Hillwood International Energy
Holmes Western Oil Corporation
J. M. Huber Corporation
Kinder Morgan CO2 Company L.P.
Lake Ronel Oil Company
Leed Petroleum LLC
Linn Operating, Inc.
Manti Resources
Mariner Energy, Inc.
Maritech Resources, Inc.
McElvain Oil & Gas Properties, Inc.
McMoran Oil and Gas Company
Medco Petroleum Management LLC
Merit Energy Company
Mewbourne Oil Company
Murchison Oil & Gas Inc.
Mustang Fuel Corporation
Nations Petroleum Company Ltd.
Nearburg Producing Company
Newfield Exploration Company
Nexen Petroleum U.S.A., Inc.
NFR Energy LLC
Noble Energy, Inc.
Oasis Petroleum
Oxy Long Beach, Inc. (Thums Long Beach)
Panhandle Oil and Gas Inc.
PDC Energy (Petroleum
Development Corporation)
Penn Virginia Corporation
Petroglyph Energy, Inc.
Petrohawk Energy Corporation
Petro-Hunt, LLC
PetroQuest Energy, Inc.
Phoenix Exploration Company
Pioneer Natural Resources Company
Plains Exploration & Production Company | | BreitBurn Energy Partners LP
| BOPCO, L.P.
| |
QEP Resources, Inc. (Questar
Market Resources)
Quantum Resources Management, LLC
| | BreitBurn Energy Partners LP –
| BreitBurn Energy
| | Questar Market Resources Group
| | Eastern Division
| Brigham Exploration Company
| |
Quicksilver Resources Inc.
| | BreitBurn Energy Partners LP –
| Browning Oil Company, Inc.
| |
Range Resources Corporation
| | Orcutt Facility
| Cabot Oil
Read & Gas Corporation
| | Read and Stevens, Inc.
| | BreitBurn
Resolute Energy Partners LP – West
| Cano Petroleum, Inc.
| | Corporation
Rex Energy Operating Corp. | | Pico Facility
| Ceja Corporation
| |
Rosetta Resources, Inc.
| | BreitBurn Energy Partners LP –
| Chaparral Energy, Inc.
| |
Samson
| | Western Div – California Operations
| Chesapeake Energy Corporation
| |
Seneca Resources Corporation
| | BreitBurn Energy Partners LP –
| Cimarex Energy Co.
| |
Sheridan Production Company
Sinclair Oil and GasServices Company
| | Western Div – Florida Operations
| Cohort Energy Company
| |
Southwestern Energy Production Company
| | BreitBurn Energy Partners LP –
| Comstock Resources, Inc.
| |
St. Mary Land & Exploration Company
| | Western Div – Wyoming Operations
| Concho Resources, Inc.
| |
Stone Energy Corporation
| | BreitBurn Energy Partners LP –
| Continental Resources, Inc.
| |
Summit Petroleum LLC
Swift Energy Operating, LLC
| | Western Division
| Core Minerals Operating Co.,Company
Talisman Energy USA Inc.
| | (Fortuna)
T-C Oil Company | | Bridwell Oil Company
| Crimson Exploration, Inc.
| |
Tema Oil and Gas Company
| | Brigham Exploration Company
| Dart Oil & Gas
| | Texas Petroleum Investment Company
| | Brookfield Asset Management, Inc. –
| Denbury Resources Inc.
| | Thums Long Beach Company
| | Brookfield Renewable Power
| Devon Energy
| | TOTAL
Total E&P USA, INC.
| | Bunge Ltd. – BG US Services
| Dominion Exploration & Production
| | Inc.
Triad Energy Corporation | | Burnett Oil Company, Inc.
| Duncan Oil Properties, Inc./
| |
Tri-Valley Corporation
| | California ISO
| Walter Duncan, Inc.
| | Ultra Petroleum Corp. | | Cameron International Corporation
| Dynamic Offshore Resources, LLC
| | Vanco Energy Company
| | Cameron International Corporation –
| Eagle Rock Energy G&P, LLC
| |
Vantage Energy L.L.C
| | Aftermarket
| Ellora Energy
| |
Venoco, Inc.
| | Cameron International Corporation –
| EnCana Oil & Gas (USA) Inc.
| |
Vernon E. Faulconer, Inc.
| | Centrifugal
| Encore Acquisitions Company
| |
Wagner & Brown, Ltd.
| | Cameron International Corporation –
| Energen Resources
| | Western Production Company
| | Compression Systems
| Energy Partners, Ltd.
| | Weyerhaeuser Company
| | Cameron International Corporation –
| Eni Operating Co.
Walter Duncan, Inc.
| |
Whiting Petroleum Corporation
| | Distributed Valves
| EOG Resources Inc.
| |
Williams
| | Cameron International Corporation –
| EQT Production Company
| |
Woodside Energy (USA) Inc
| | Drilling & Production Systems
| Fasken Oil and Ranch, Ltd.
| |
Wynn-Crosby
XTO Energy Inc.
| | Cameron International Corporation –
| Fidelity
Yuma Exploration & Production Company
| | Yuma Exploration and Production
| | Drilling Systems
| FIML Natural Resources
| |
Company, Inc.
| | Cameron International Corporation –
| Forest Oil Corporation
| | | | Engineered Valves
| Fortuna Energy, Inc.
| | | | Cameron International Corporation –
| GMX Resources Inc.
| |
Mercer’s 20092010 Total
Compensation
| | Flow Control
| Goodrich Petroleum Corporation
| | Survey for
the Energy Sector
| | Cameron International Corporation –
| Great Western Drilling Company
| | | | Measurement Division
| Harvest NaturalAGL Resources
AGL Resources Inc.
| | – Sequent
Energy Management
Abraxas Petroleum Corporation | | Cameron International Corporation –
| Headington Oil Company, L.P.
| |
Aera Energy, LLC
| | Petreco Process Systems
| Henry Resources LLC
| | AGL Resources, Inc.
| | Cameron International Corporation –
| Hilcorp Energy Company
| |
Aker Solutions
| | Process Valves
| J. M. Huber Corporation – Energy Sector
| |
Alliance Pipeline Inc.
| | Cameron International Corporation –
| Kinder Morgan CO2 Company, L.P.
| |
Alyeska Pipeline Service Company
| | Reciprocating
| Lake Ronel Oil Company
| |
Ameren Corporation
| | Cameron International
Ameren Corporation –
| Leed Petroleum LLC
| | Anadarko Petroleum AmerenEnergy
Fuels & Services
Ameren Corporation
| | Subsea Systems
| Linn –
Ameren Energy Inc.
| | Resources
Ameren Corporation – AmerienIllinois
Ameren Corporation – AmerenUE
American Transmission Company
Apache Corporation | | Cameron International Corporation –
| Mariner Energy, Inc.
| |
Arch Coal, Inc.
| | Surface Systems
| McElvain Oil and Gas Properties, Inc.
| | Aspect Energy, LLC
| | Cameron International Corporation –
| McMoran Oil and Gas Company
| | Aspect Energy, LLC – Aspect Abundant
| | Valves & Measurement
| Medco Petroleum Management LLC
| | Shale LP
| | CenterPoint Energy, Inc.
| Merit Energy Company
| | Aspect Energy, LLC – Hungaria
| | CGGVeritas
| Mewbourne Oil Company
| | Horizon Energy
| | Chesapeake Energy Corporation
| Mustang Fuel Corporation
| |
Associated Electric Cooperative, Inc.
| | Chesapeake
Atlas Energy, Corporation – CEMI
| Nearburg Producing Company
| | Atlas America, Inc.
| | Chesapeake Energy Corporation –
| Newfield Exploration Company
| | Atlas Pipeline Mid-Continent
| | Chesapeake App
| Nexen
BG US Services
BHP Billiton Petroleum U.S.A.(Americas), Inc.
| |
Baker Hughes, Inc.
| | Chesapeake Energy Corporation –
| NFR Energy LLC
| |
Baker Hughes, Inc. – Baker Atlas
| | Chesapeake Midstream Partners
| Noble Energy, Inc.
| |
Baker Hughes, Inc. – Baker Hughes
Drilling Fluids
| | Chesapeake Energy Corporation
Baker Hughes, Inc. – Compass
| Oasis Petroleum LLC
| | Baker Hughes Inteq
Baker Hughes, Inc. – Baker Oil Tools | | Chesapeake Energy Corporation –
| Panhandle Oil and Gas Inc.
| |
Baker Hughes, Inc. – Baker Petrolite
| | Diamond Y
| Penn Virginia Oil & Gas
| |
Baker Hughes, Inc. – Centrilift
| | Chesapeake Energy Corporation
Baker Hughes, Inc. –
| Petro-Canada Resources (USA) Inc
| | Gaffney, Cline &
Associates
Baker Hughes, Inc. – GeoMechanics
International
Baker Hughes, Inc. – Hughes Christensen | | Great Plains
| PETROFLOW Energy, Ltd.
| | Baker Hughes, Inc. – Inteq
| | Chesapeake Energy Corporation –
| Petroglyph Energy, Inc.
| |
Baker Hughes, Inc. – Production Quest
| | Hodges
| Petrohawk Energy Corporation
| |
Basic Energy Services Inc.
| | Chesapeake
Baytex Energy Corporation –
| Petro-Hunt, LLC
| | BHP Billiton,USA Ltd. – BHP Billiton Petroleum
| | Midcon
| Petroleum Development Corporation
| | (Americas), Inc.
| | Chesapeake Energy Corporation –
| PetroQuest Energy LLC
| |
Boardwalk Pipeline Partners, LP
| | Nomac
| Phoenix
BreitBurn Energy Partners L.P.
BreitBurn Energy Partners L.P. – Eastern
Division
BreitBurn Energy Partners L.P. –
Orcutt Facility
BreitBurn Energy Partners L.P. –
West Pico Facility
BreitBurn Energy Partners L.P. –
Western Division
BreitBurn Energy Partners L.P. –
Western Division, California Operations
BreitBurn Energy Partners L.P. –
Western Division, Florida Operations
BreitBurn Energy Partners L.P. –
Western Division, Wyoming Operations
Brigham Exploration Company
| | BP plc – BP North America Exploration
| | Chief Oil & Gas, LLC
| Pioneer Natural Resources USA, Inc.
| | & Production
| | CHS, Inc. – Energy
Brookfield Renewable Power
|
| | | | MDU Resources Group, Inc.Proxy Statement | A-5 |
| | | | | Cimarex Energy Company
| | Explorer Pipeline Company
| | Oceaneering International, Inc.
| Cinco Natural Resources Corporation
| | Exterran Holdings, Inc.
| | Oceaneering International, Inc. – Americas
| Citation Oil & Gas Corporation
| | Fasken Oil and Ranch, Ltd.
| | Oceaneering International, Inc. – Multiflex
| CITGO Petroleum Corporation
| | Forest Oil Corporation
| | Oceaneering International, Inc. –
| Cleco Corporation
| | Fortuna Energy, Inc.
| | Oceaneering Intervention Engineering
| Concho Resources, Inc. –
| | FX Energy, Inc.
| | OGE Energy Corp
| COG Operating, LLC
| | FX Energy, Inc – FX Drilling Company, Inc.
| | Oglethorpe Power Corporation
| Colonial Pipeline Company
| | Genesis Energy, LLC
| | ONEOK, Inc.
| Conectiv Energy
| | Global Industries, Ltd.
| | ONEOK, Inc. – Kansas Gas Service Division
| Constellation Energy Partners, LLC
| | Great River Energy
| | ONEOK, Inc. – Oklahoma Natural
| Core Laboratories N.V.
| | Halliburton Company
| | Gas Division
| CPS Energy
| | Helmerich & Payne, Inc.
| | ONEOK, Inc. – ONEOK Energy Services
| DCP Midstream, LLC
| | Hess Corporation – Exploration & Production
| | ONEOK, Inc. – ONEOK Partners
| Det Norske Veritas AS – Det Norske Veritas
| | HighMount Exploration & Production, LLC
| | ONEOK, Inc. – Texas Gas Service Divison
| (USA), Inc
| | Hilcorp Energy Company
| | PacifiCorp
| Devon Energy Corporation
| | Hilcorp Energy Company – Harvest Pipeline
| | Parallel Petroleum Corporation
| Diamond Offshore Drilling, Inc.
| | Company
| | Parker Drilling Company
| Dominion Resources, Inc.
| | Holly Corporation
| | Pason Systems USA Corporation
| Dominion Resources, Inc. –
| | Holly Corporation – Holly Asphalt Company
| | Pepco Holdings, Inc.
| Dominion Energy
| | Holly Corporation – Holly Logistic Services
| | Petro-Canada USA, Inc.
| Dominion Resources, Inc. –
| | Holly Corporation – Holly Refining and
| | Petroleum Development Corporation
| Dominion Generation
| | Marketing Woods Cross
| | Pioneer Natural Resources Company
| Dominion Resources, Inc. – Dominion
| | Holly Corporation –
| | PJM Interconnection
| Virginia Power
| | Navajo Refining Company
| | Plains All American Pipeline LP
| Dresser-Rand Group, Inc.
| | Hunt Consolidated – Hunt Oil Company
| | Plains Exploration & Production Company
| Dresser-Rand Group, Inc. – Field Operations
| | Jacksonville Electric Authority
| | Precision Drilling Oilfield Services
| Dresser-Rand Group, Inc. –
| | Kinder Morgan, Inc.
| | Corporation
| North America Operations
| | Lario Oil & Gas Company
| | Pride International, Inc.
| Dresser-Rand Group, Inc. – Product Services
| | Legacy Reserves LP
| | ProLiance Energy, LLC
| DTE Energy Company
| | Linn Energy, LLC
| | Puget Sound Energy
| DynMcDermott Petroleum Operations
| | Maersk, Inc. – Moller Supply Services
| | Questar Corporation
| Edison Mission Energy
| | Magellan Midstream Holdings LP
| | Questar Corporation – Questar
| Edison Mission Energy –
| | Magellan Midstream Holdings LP –
| | Market Resources
| Edison Mission M&T
| | Transportation
| | Quicksilver Resources, Inc.
| Edison Mission Energy –
| | Magellan Midstream Holdings LP –
| | R. Lacy, Inc. – R. Lacy Services, Ltd.
| Edison Mission O&M
| | Transportation and Terminals
| | RAM Energy Resources, Inc.
| Edison Mission Energy –
| | MarkWest Energy Partners LP
| | Range Resources Corporation
| EME Homer City Generation
| | MarkWest Energy Partners LP –
| | Regency Gas Services
| Edison Mission Energy –
| | Gulf Coast Business Unit
| | Resolute Natural Resources Company
| Midwest Generation EME
| | MarkWest Energy Partners LP –
| | RKI Exploration & Production, LLC
| Edison Mission Energy –
| | Northeast Business Unit
| | Rosewood Resources, Inc.
| Midwest Generation, LLC
| | MarkWest Energy Partners LP –
| | Rosewood Resources, Inc. –
| El Paso Corporation
| | Southwest Business Unit
| | Rosewood Services Company
| El Paso Corporation – Exploration
| | McMoRan Exploration Company
| | Rowan Companies, Inc.
| & Production
| | MCX Exploration (USA), Ltd.
| | SAIC, Inc.
| El Paso Corporation – Pipeline Group
| | MDU Resources Group, Inc.
| | SCANA Corporation
| EnCana Oil & Gas (USA), Inc.
| | MDU Resources Group, Inc. –
| | SCANA Corporation – Carolina Gas
| Energy Future Holdings Corporation
| | WBI Holdings, Inc.
| | Transmission Corporation (CGTC)
| Energy Future Holdings Corporation –
| | Medco Petroleum Management
| | SCANA Corporation – PSNC Energy
| Luminant
| | Mestena Operating, Ltd.
| | SCANA Corporation – SCE&G (South Carolina
| Energy Future Holdings Corporation –
| | Mirant Corporation
| | Electric and Gas Company)
| Luminant Energy Company, LLC
| | MitEnergy Upstream, LLC
| | SCANA Corporation – SEMI (SCANA
| Energy Future Holdings Corporation –
| | Murphy Oil Corporation
| | Energy Marketing, Inc.)
| Oncor Electric Delivery Company, LLC
| | NATCO Group, Inc.
| | Schlumberger Limited – Schlumberger
| Energy Future Holdings Corporation –
| | Nexen, Inc. – Nexen Petroleum USA, Inc.
| | Oilfield Services
| TXU Energy Retail Company, LLC
| | Nippon Oil Exploration USA, Ltd.
| | Seneca Resources Corporation
| Enerplus Resources Fund – Enerplus
| | NiSource, Inc.
| | Smith International, Inc.
| Resources (USA) Corporation
| | NiSource, Inc. – Bay State Gas Company
| | Smith International, Inc. – MI Swaco
| EnerVest Management Partners, Ltd.
| | NiSource, Inc. – Columbia Gas of Kentucky
| | Southern Company
| Eni SpA – Eni US Operating Company, Inc.
| | NiSource, Inc. – Columbia Gas of Ohio
| | Southern Company – Alabama
| ENSCO International, Inc.
| | NiSource, Inc. – Columbia Gas of
| | Power Company
| ENSCO International, Inc. –
| | Pennsylvania
| | Southern Company – Georgia Power
| Deepwater Business Unit
| | NiSource, Inc. – Columbia Gas of Virginia
| | Southern Company – Gulf Power Company
| ENSCO International, Inc. –
| | NiSource, Inc. – Energy USA
| | Southern Union Company
| North & South America Business Unit
| | NiSource, Inc. – NIE
| | Southern Union Company – Missouri
| Entegra Power Services, LLC
| | NiSource, Inc. – NiSource Energy Tech Inc
| | Gas Energy
| EOG Resources, Inc.
| | NiSource, Inc. – NiSource Gas Trans
| | Southern Union Company – New
| E. ON AG – E. ON U.S.
| | & Storage
| | England Gas
| EXCO Resources, Inc.
| | NiSource, Inc. – Transmission Corp
| | Southern Union Company – Panhandle
| EXCO Resources, Inc. – EXCO Appalachia
| | Noble Corporation
| | Energy
| EXCO Resources, Inc. – EXCO East TX/LA
| | Noble Corporation – Noble Drilling Services,
| | Southern Union Company – Southern
| EXCO Resources, Inc. – EXCO Mid-Continent
| | Inc.
| | Union Gas Services
| EXCO Resources, Inc. – EXCO Midstream
| | Noble Energy, Inc.
| | Southwest Gas Corporation
| EXCO Resources, Inc. –
| | Occidental Petroleum Corporation –
| | Southwestern Energy Company
| EXCO Permian/Rockies
| | Thums Long Beach Company
| | Sprague Energy Corporation
|
| | | | A-6
| MDU Resources Group, Inc.Proxy Statement
|
| | | | | StatoilHydro
| | Aker Solutions
| | The Arizona Republic
| Tellus Operating Group, LLC
| | Alaska Air Group, Inc.
| | Arkansas Best Corporation
| Tesco Corporation
| | Albemarle Corporation
| | Armstrong World Industries, Inc.
| The Williams Companies, Inc.
| | Alcoa, Inc.
| | Arrow Electronics, Inc.
| The Williams Companies, Inc. – E&P
| | Alexander & Baldwin, Inc.
| | ArvinMeritor, Inc.
| The Williams Companies, Inc. – Midstream
| | Alfa Laval, Inc.
| | Asbury Automotive Group, Inc.
| The Williams Companies, Inc. – Williams Gas
| | Allegheny County Sanitary Authority
| | ASCAP
| Pipeline (WGP)
| | Allegheny Energy, Inc.
| | Ascent Media Group
| TransCanada
| | Allegheny Technologies Incorporated
| | Ashland, Inc.
| TransCanada – Gas Transmission Northwest
| | Allergan, Inc.
| | Asset Marketing Service, Inc.
| (GTN)
| | Allete
| | Assurant Health
| TransCanada – Northern Border Pipeline
| | Alliance Data Systems Corporation
| | Assurant, Inc.
| TransCanada – US Pipeline Central
| | Alliance Residential Company
| | Asurion Corporation
| Transocean, Inc.
| | Alliant Energy Corporation
| | AT&T, Inc.
| Ultra Petroleum Corporation
| | The Allstate Corporation
| | Atmos Energy Corporation
| Unit Corporation
| | Alpha Innotech Corporation
| | Aurora Healthcare
| Unit Corporation – Superior Pipeline
| | Alpha Natural Resources, Inc.
| | The Auto Club Group
| Company
| | ALSAC St. Jude
| | Autodesk, Inc.
| Unit Corporation – Unit Drilling Company
| | Altria Group, Inc.
| | Autoliv North America, Inc.
| Unit Corporation – Unit Petroleum Company
| | Altru Health System
| | Automobile Club of Southern California
| Venoco, Inc.
| | Amazon.com, Inc.
| | AutoNation, Inc.
| Verado Energy, Inc.
| | Amcore Bank
| | AutoZone, Inc.
| Washington Gas Light Company
| | Ameren Corporation
| | Aveda Corporation
| Weatherford International, Ltd.
| | American Airlines
| | Avery Dennison Corporation
| Weatherford International, Ltd. – US Region
| | American Axle & Manufacturing
| | Avis Budget Group
| Western Production Company
| | Holdings, Inc.
| | Avista Corporation
| Xcel Energy, Inc.
| | American Cancer Society, Inc.
| | Avon Products, Inc.
| XTO Energy, Inc.
| | American Commercial Lines, Inc.
| | Axsys
| | | American Dehydrated Foods, Inc.
| | B Braun Medical, Inc.
| | | American Eagle Outfitters
| | Babcock & Wilcox Company
| Watson Wyatt’s (Towers Watson)
| | American Electric Power Company, Inc.
| | Babson College
| 2009/2010 Top Management
| | American Enterprise
| | Baker Hughes Incorporated
| Compensation Survey
| | American Express Company
| | Baldor Electric Company
| | | American Family Insurance
| | Ball Corporation
| 3M Company
| | American Financial Group
| | Bank of America Corporation
| A. O. Smith Corporation
| | American Greetings Corporation
| | The Bank of New York Mellon Corporation
| A. Schulman, Inc.
| | American Red Cross
| | Baptist Health
| AAA
| | American Water
| | Baptist Health System
| ABB, Inc.
| | Americas Styrenics
| | Barloworld Handling
| Abbott Laboratories
| | AMERIGROUP Corporation
| | Barnes & Noble, Inc.
| Abercrombie & Fitch Company
| | AmeriPride Services, Inc.
| | Basler Electric Company
| ABM Industries, Inc.
| | Ameriprise Financial, Inc.
| | Baxa Corporation
| Accor North America
| | AmerisourceBergen Corporation
| | Baxter International, Inc.
| Activision Blizzard, Inc.
| | Ameristar Casinos
| | Baylor College of Medicine
| The Actors Fund of America
| | Ames True Temper
| | Baylor Health Care System
| Actuant Corporation
| | AMETEK, Inc.
| | BB&T Corporation
| Acuity
| | AMETEK, Inc./Advanced Measurement
| | BE Aerospace, Inc.
| Acuity Brands, Inc.
| | Technology, Inc.
| | Beacon Roofing Supply, Inc.
| ACUMED LLC
| | Amgen, Inc.
| | BearingPoint, Inc.
| Adams Resources & Energy, Inc.
| | Amkor Technology, Inc.
| | Beazer Homes USA, Inc.
| Administaff, Inc.
| | Amphenol Corporation
| | Bechtel Systems & Infrastructure, Inc.
| Adobe Systems Incorporated
| | AMR Corporation
| | Beckman Coulter, Inc.
| ADTRAN Incorporated
| | Amtrak
| | Becton, Dickinson and Company
| Advance Auto Parts
| | Anadarko Petroleum Corporation
| | Behr America, Inc.
| Advanced Micro Devices, Inc.
| | Analog Devices, Inc.
| | Belden, Inc.
| Adventist Health System
| | Anchor Bank North America
| | Belk, Inc.
| AECOM Technology Corporation
| | Andersen Corporation
| | Bemis Company, Inc.
| Aegon USA
| | The Andersons, Inc.
| | Bemis Manufacturing Company
| Aeropostale, Inc.
| | ANH Refractories Company
| | Benchmark Electronics, Inc.
| The AES Corporation
| | Anixter International, Inc.
| | Berkshire Hathaway, Inc.
| Aetna, Inc.
| | AnnTaylor Stores Corporation
| | Berwick Offray LLC
| Affiliated Computer Services, Inc.
| | The Antioch Company
| | Best Buy Co., Inc.
| Affinia Group, Inc.
| | Aon Corporation
| | Big Lots, Inc.
| Affinity Plus Federal Credit Union
| | APAC Customer Services
| | Biodynamic Research Corporation
| AFLAC Incorporated
| | Apache Corporation
| | Biogen Idec, Inc.
| AGCO Corporation
| | Apollo Group
| | Biomet
| AgFirst
| | Apple, Inc.
| | Bio-Rad Laboratories, Inc.
| Agilent Technologies, Inc.
| | Applied Materials, Inc.
| | BJ Services Company
| AGL Resources, Inc.
| | AptarGroup, Inc.
| | BJ’s Wholesale Club
| AgriBank, FCB
| | ARAMARK Corporation
| | The Black & Decker Corporation
| Air Products & Chemicals, Inc.
| | Arch Coal, Inc.
| | BlackRock, Inc.
| Airlines Reporting Corporation
| | Archstone
| | Blockbuster, Inc.
| AirTran Holdings, Inc.
| | Areva NP, Inc.
| | Blue Cross & Blue Shield of Nebraska
| AK Steel Holding Corporation
| | ARINC, Inc.
| | Blue Cross & Blue Shield of South Carolina
|
| | | | MDU Resources Group, Inc.Proxy Statement
| A-7
|
| | | | | Blue Cross & Blue Shield of Tennessee
| | Celanese Corporation
| | Constellation Energy Group, Inc.
| Blue Cross Blue Shield of Louisiana
| | Celgene Corporation
| | Continental Airlines, Inc.
| Blue Cross of Idaho Health Service, Inc.
| | Cell Therapeutics, Inc.
| | Convenience Food Systems, Inc.
| Blue Cross of Northeastern Pennsylvania
| | CEMEX, Inc.
| | Convergys Corporation
| BlueLinx Holdings, Inc.
| | Centene Corporation
| | Con-way, Inc.
| BMW Manufacturing Corporation
| | CenterPoint Energy, Inc.
| | Cooper Standard Automotive
| Board of Governors of the Federal
| | Century Aluminum Company
| | Cooper Tire & Rubber Company
| Reserve System
| | Century Tel, Inc.
| | Core Laboratories
| Bob Evans Farms
| | Cenveo, Inc.
| | Core-Mark Holding Company, Inc.
| The Boeing Company
| | Cephalon, Inc.
| | Corn Products International, Inc.
| Boise Cascade Holdings LLC
| | CF Industries Holdings, Inc.
| | Cornell University
| Boise, Inc.
| | The Charles Schwab Corporation
| | Corning Incorporated
| The Bon-Ton Stores, Inc.
| | Chemtreat, Inc.
| | Correctional Medical Services
| Borders Group, Inc.
| | Chenega Corporation
| | Corrections Corporation of America
| BorgWarner, Inc.
| | Chesapeake Energy Corporation
| | Costco Wholesale Corporation
| Bosch Packaging Services
| | Chevron Corporation
| | Country Insurance & Financial
| Boston Scientific Corporation
| | Chicago Transit Authority
| | The Country Vintner
| Boy Scouts of America
| | Chico’s FAS, Inc.
| | Covance, Inc.
| Boyd Gaming Corporate
| | Children’s Healthcare Atlanta
| | Coventry Health Care, Inc.
| Boys & Girls Clubs of America
| | Children’s Home Society
| | Cox Enterprises, Inc.
| Bradley Corporation
| | Chiquita Brands International, Inc.
| | Cox Target Media Valpak
| Brady Corporation
| | Choice Hotels International
| | CPS Energy
| Briggs & Stratton Corporation
| | CHS, Inc.
| | Cracker Barrel Old Country Store, Inc.
| Brightpoint, Inc.
| | The Chubb Corporation
| | Crane Company
| The Brink’s Company
| | Chumash Employee Resource Center
| | Cree, Inc.
| Bristol Myers Squibb Company
| | Church & Dwight Co., Inc.
| | Croda, Inc.
| Broadcom Corporation
| | Church of Jesus Christ of Latter-Day Saints
| | Crosstex Energy, Inc.
| Broadridge Financial Solutions, Inc.
| | CIGNA Corporation
| | Crown Castle International Corporation
| Brookdale Senior Living, Inc.
| | Cimarex Energy Company
| | Crown Cork & Seal
| Brown Shoe Company, Inc.
| | Cincinnati Financial Corporation
| | CSX Corporation
| Brownells, Inc.
| | Cinemark Holdings, Inc.
| | Cummins, Inc.
| Brunswick Corporation
| | CIT Group, Inc.
| | CUNA Mutual Group
| Bryant University
| | Citationshares
| | Curtiss-Wright Corporation
| BSSI
| | Citigroup, Inc.
| | CVR Energy, Inc.
| Buckeye GP Holdings LP
| | City of Austin
| | CVS Caremark
| Bucyrus International, Inc.
| | City of Charlotte
| | Cypress Semiconductor Corporation
| Buffets, Inc.
| | City of Columbus
| | Cytec Industries, Inc.
| Building Materials Holding Corporation
| | City of Garland
| | D & E Communications, Inc.
| Burger King Holdings, Inc.
| | City of Houston
| | D.R. Horton, Inc.
| Burlington Northern Santa Fe Corporation
| | City of Philadelphia
| | Daimler Financial Services
| C.H. Robinson Worldwide, Inc.
| | Clarian Health Partners
| | Dakota Electric Association
| C.R. Bard, Inc.
| | Cleco Corporation
| | Dallas County
| Cabela’s Incorporated
| | Cliffs Natural Resources, Inc.
| | Dal-Tile, Inc.
| Cablevision Systems Corporation
| | The Clorox Company
| | Dana Holding Corporation
| Cabot Corporation
| | ClubCorp, Inc.
| | Danaher Corporation
| CACI International, Inc.
| | CME Group, Inc.
| | Data Center, Inc.
| Caelum Research Corporation
| | CMS Energy Corporation
| | DaVita, Inc.
| Calibre Systems
| | CNL Financial Group
| | Dean Foods
| California Casualty Management Company
| | Coca-Cola Bottling Company Consolidated
| | Deckers Outdoor Corporation
| California Institute of Technology
| | The Coca-Cola Company
| | The Decurion Corporation
| California Water Service Company
| | Coca-Cola Enterprises, Inc.
| | Deere & Company
| Calpine Corporation
| | Cognizant Technology Solutions Corporation
| | Dekalb Regional Healthcare Systems
| Calumet Specialty Products Partners LP
| | Colgate-Palmolive Company
| | Del Monte Fresh Produce Company
| Cameron International Corporation
| | Collective Brands, Inc.
| | Delorme Publishing
| Camoplast, Inc.
| | The Colman Group, Inc.
| | Delphi Corporation
| Campbell Soup Company
| | Colonial Bank
| | Delta Air Lines, Inc.
| Canyon Ranch
| | Colorado Springs Utilities
| | Denso International America
| Capital One Financial Corporation
| | Colsa Corporation
| | Denso Manufacturing Michigan, Inc.
| Career Education Corporation
| | Columbia Sportswear Company
| | DENTSPLY International, Inc.
| Career Service Authority City and County
| | Columbus Foods LLC
| | DePaul University
| of Denver
| | Comcast Corporation
| | Devon Energy Corporation
| CareFirst BlueCross BlueShield
| | Comerica Incorporated
| | DeVry University
| Carle Clinic Association
| | Commercial Metals Company
| | DFW International Airport
| Carlisle Companies, Inc.
| | CommScope, Inc.
| | Dick’s Sporting Goods
| Carlson Companies, Inc.
| | Community Health Network
| | Dickstein Shapiro LLP
| CarMax
| | Community Health Systems
| | Diebold Incorporated
| Carpenter Technology Corporation
| | The Community Preservation Corporation
| | Dillard’s, Inc.
| Carter
| | Compass Group, North America Division
| | Direct Financial Solutions, Inc.
| Casino Arizona
| | Complete Production Services, Inc.
| | The DIRECTV Group, Inc.
| Catalyst Health Solutions, Inc.
| | Computer Sciences Corporation
| | Discover Financial Services
| Caterpillar, Inc.
| | Computer Task Group
| | Discovery Communications, Inc.
| CB Richards Ellis
| | ConocoPhillips
| | DISH Network Corporation
| CBS Corporation
| | Conseco, Inc.
| | Doherty Employer Services
| CC Media Holdings, Inc.
| | CONSOL Energy, Inc.
| | Dole Food Company, Inc.
| CDM
| | Consolidated Edison, Inc.
| | Dollar General Corporation
|
| | | | A-8
| MDU Resources Group, Inc.Proxy Statement
|
| | | | | Dominion Resources, Inc.
| | Family Dollar Stores, Inc.
| | Genuine Parts Company
| Donaldson Company, Inc.
| | Farmland Foods, Inc.
| | Genworth Financial, Inc.
| Dover Corporation
| | Fastenal Company
| | Genzyme Corporation
| The Dow Chemical Company
| | FCI USA, Inc.
| | Georg Fischer Signet LLC
| Dr. Pepper Snapple Group, Inc.
| | Federal Home Loan Bank of Atlanta
| | Georgia Gulf Corporation
| Dresser-Rand Group, Inc.
| | Federal Reserve Bank of Atlanta
| | Georgia Institute of Technology
| DSC Logistics
| | Federal Reserve Bank of Boston
| | Georgia System Operations Corporation
| DST Systems, Inc.
| | Federal Reserve Bank of Cleveland
| | Gerdau Ameristeel
| DTE Energy
| | Federal Reserve Bank of Dallas
| | Gilead Sciences, Inc.
| Duane Reade Holdings, Inc.
| | Federal Reserve Bank of Kansas City
| | Global Partners LP
| Duke Energy Corporation
| | Federal Reserve Bank of Minneapolis
| | Godiva, Inc.
| Duke Realty Corporation
| | Federal Reserve Bank of Philadelphia
| | Gold Eagle Company
| Duke University & Health System
| | Federal Reserve Bank of San Francisco
| | Goldman Sachs Group, Inc.
| The Dun & Bradstreet Corporation
| | Federal Reserve Bank of St. Louis
| | Goodrich Corporation
| DuPont
| | FedEx Express
| | The Goodyear Tire & Rubber Company
| Dynegy, Inc.
| | FedEx Ground
| | Google, Inc.
| DynMcDermott
| | FedEx Office
| | Government Employees Health
| E J Brooks Company
| | Fender Musical Instruments
| | Association, Inc.
| E*TRADE Financial Corporation
| | Ferguson Enterprises
| | Graco, Inc.
| The E.W. Scripps Company
| | Fermi National Accelerator Laboratory
| | Graham Packaging
| Eagle Rock Energy Partners LP
| | FerrellGas, Inc.
| | Grande Cheese Company
| Early Warning Services
| | Ferro Corporation
| | Grange Mutual Insurance Companies
| Eastman Chemical Company
| | Fidelity National Financial, Inc.
| | Granite Construction, Inc.
| Eastman Kodak Company
| | Fidelity National Information Services
| | Graybar Electric Company, Inc.
| Eaton Corporation
| | Fifth Third Bancorp
| | Great Plains Energy Incorporated
| eBay
| | The First American Corporation
| | Greatwide Truckload Management
| Ecolab, Inc.
| | First American Corporation
| | Greif, Inc.
| Edison International
| | First Bank
| | Greyhound Lines, Inc.
| Edison Mission Energy
| | First Citizens Bank
| | Group 1 Automotive, Inc.
| Education Management Corporation
| | First Data Corporation
| | GuideStone Financial Resources
| Edward Jones & Company
| | First Horizon National Corporation
| | Gulfstream Aerospace Corporation
| Edwards Lifesciences
| | First Interstate BancSystem
| | H Lee Moffitt Cancer Center &
| EG&G – Defense Materials
| | First Place Bank
| | Research Institute
| EG&G Services
| | First Priority
| | Halliburton Company
| El Paso Corporation
| | First Solar, Inc.
| | Hanesbrands, Inc.
| Element K
| | FirstEnergy Corporation
| | Hannaford Bros. Company
| Eli Lilly & Company
| | Fiserv, Inc.
| | The Hanover Insurance Group, Inc.
| Elizabeth Arden, Inc.
| | Fleetwood Group
| | Hapag-Lloyd (America), Inc.
| EMC Corporation
| | Flexcon Company, Inc.
| | Harley Davidson Motor Company
| EMCOR Group, Inc.
| | Flexible Steel Lacing Company
| | Harman International Industries, Inc.
| Emerson Climate Technologies/Copeland
| | Florida’s Blood Centers, Inc.
| | Harrah’s Entertainment
| Emerson Electric
| | Flowers Foods, Inc.
| | Harris County Hospital District
| Enbridge Energy Partners LP
| | Flowserve Corporation
| | Harsco Corporation
| Energizer Holdings, Inc.
| | Fluor Corporation
| | Hartford Financial Services
| Energy Future Holdings Corporation
| | FMC Corporation
| | Harvard Vanguard Medical Association
| Energy Transfer Equity LP
| | FMC Technologies, Inc.
| | Harvey Industries
| Ensco International Incorporated
| | Foot Locker, Inc.
| | Hasbro, Inc.
| Entergy Corporation
| | Ford Motor Company
| | Hastings Mutual Insurance Company
| Enterprise GP Holdings LP
| | Forth Worth Independent School District
| | Hawaiian Electric Industries, Inc.
| Entertainment Publications
| | Fortune Brands
| | Haynes International, Inc.
| EOG Resources, Inc.
| | Foseco Metallurgical, Inc.
| | Hazelden Foundation
| EON US LLC
| | Fox Chase Cancer Center
| | HCA, Inc.
| Equifax, Inc.
| | FPL Group, Inc.
| | HCC Insurance Holdings, Inc.
| Equity Residential
| | Franklin Resources, Inc.
| | HD Supply
| Erie Insurance Group
| | Franklin W Olin College Engineering
| | Health Management Associates, Inc.
| ESCO Corporation
| | Freeman Companies
| | Health Net
| ESCO Technologies
| | Freeport-McMoRan Copper & Gold, Inc.
| | Health Partners
| The Estee Lauder Companies, Inc.
| | Freescale Semiconductor, Inc.
| | HealthNow New York
| Esterline Technologies Corporation
| | Fremont Group
| | HealthSouth Corporation
| Etnyre International, Ltd.
| | Froedtert & Community Health
| | HealthSpring, Inc.
| Europ Assistance USA
| | Frontier Communications Corporation
| | HealthTrans
| Evraz Oregon Steel Mills
| | Frontier Oil Corporation
| | H-E-B
| Exel, Inc.
| | Furniture Brands International, Inc.
| | Helix Energy Solutions Group, Inc.
| Exelon Corporation
| | G&K Services
| | Helmerich & Payne, Inc.
| Exempla Health Care, Inc.
| | G. Loomis, Inc.
| | Hendrick Medical Center
| Exide Technologies
| | Gannett Co., Inc.
| | Hendrickson International
| Expedia, Inc.
| | The Gap, Inc.
| | Henry Ford Health System
| Expeditors International of Washington
| | Gardner Denver, Inc.
| | Henry Schein, Inc.
| Experian
| | Garmin International
| | Herman Miller, Inc.
| Express Scripts, Inc.
| | Gaylord Entertainment
| | The Hershey Company
| Extendicare Health Services
| | General Cable Corporation
| | The Hertz Corporation
| Exterran Holdings, Inc.
| | General Dynamics Corporation
| | Hess Corporation
| Exxon Mobil Corporation
| | General Dynamics Information Technology
| | Hewitt Associates, Inc.
| FAIR Plan Insurance Placement Facility
| | General Growth Properties, Inc.
| | Hewlett-Packard Company
| of Pennsylvania
| | General Motors Corporation
| | Hexion Specialty Chemicals, Inc.
|
| | | | MDU Resources Group, Inc.Proxy Statement
| A-9
|
| | | | | Highlights for Children, Inc.Buckeye Partners, L.P.
| | ITT Industries Advanced Engineering
| | Level 3 Communications, Inc.
| Highmark, Inc.
| | & Sciences
| | Levi Strauss & Company
| HighMount Exploration & Production LLC
| | ITT Systems Division
| | Lexmark International, Inc.
| Hill Phoenix
| | J J Keller & Associates, Inc.
| | LG Electronics USA, Inc.
| Hill-Rom Holdings, Inc.
| | J R Simplot Company
| | Liberty Global, Inc.
| Hilti, Inc.
| | J.B. Hunt Transport Services, Inc.
| | Liberty Media Corporation (Interactive)
| Hilton Hotels Corporation (Promus Hotels)
| | J.C. Penney Company, Inc.
| | LifeMasters Supported SelfCare, Inc.
| Hines Interests
| | Jabil
| | LifePoint Hospitals, Inc.
| Hitachi
| | Jack in the Box, Inc.
| | Lighthouse Computer Services
| HNI Corporation
| | Jacobs Engineering Group, Inc.
| | Limited Brands
| HNTB Corporation
| | Jacobs Technology, Inc.
| | Lincoln Electric Holdings, Inc.
| Holden Industries, Inc.
| | Jarden Consumer Solutions
| | Lincoln National Corporation
| Holly Corporation
| | Jarden Corporation
| | Lithia Motors, Inc.
| The Home Depot, Inc.
| | Jefferson Science Associates
| | Little Lady Foods
| Home Shopping Network
| | Jefferson Wells International
| | Liz Claiborne, Inc.
| HoneywellENSCO International, Inc.
| | Jet Blue AirwaysJ-W Operating Company –
| Burnett Oil Co., Inc. | | LKQ CorporationENSCO International, Inc. –
| | J-W Measurement Company | Hormel FoodsCCS Midstream Service, LLC
| | Deepwater Business Unit | | J-W Operating Company – | CEDA International Inc. | | ENSCO International, Inc. – North & South | | J-W Power Company | CGGVeritas | | America Business Unit | | J-W Operating Company – | CHS Inc. – Energy | | EOG Resources, Inc. | | J-W Wireline & Excell | CITGO Petroleum Corporation | | JM Family Enterprises
| | Lockheed Martin Corporation
| Hospira,EXCO Resources, Inc.
| | Jo-Ann Stores,Kinder Morgan, Inc.
| CPS Energy | | Lockton Companies
| Host Hotels & Resorts,EXCO Resources, Inc. – EXCO Appalachia
| | John Crane, Inc.
| | Loews CorporationLario Oil & Gas Company
| Hovnanian Enterprises, Inc.
| | John Wiley & Sons, Inc.
| | Lowe’s Companies, Inc.
| Hub Group, Inc.
| | Johns Hopkins MedicalCalfrac Well Services
| | Lower Colorado River Authority
| Hubbard Feeds, Inc.
| | Johnson & Johnson
| | Lozier Corporation
| Hubbell Incorporated
| | Johnson Controls, Inc.
| | LSG Sky Chefs
| Hudson City Bancorp, Inc.
| | Johnson Financial Group
| | LSI Corporation
| Humana, Inc.
| | JohnsonDiversey, Inc.
| | Lubrizol Corporation
| Hunter Douglas, Inc.
| | Jones Apparel Group, Inc.
| | Luck Stone Corporation
| Hunter Industries
| | Jones Lang LaSalle
| | Luther Midelfort-Mayo Health System
| Huntington Bancshares Incorporated
| | Joy Global, Inc.
| | Lutron Electronics
| Huntsman Corporation
| | JPMorgan Chase & Co.EXCO Resources, Inc. – EXCO East TX/LA
| | Luxottica RetailLegacy Reserves, LP
| Huron Consulting GroupCalifornia ISO
| | Judicial Council of CaliforniaEXCO Resources, Inc. – EXCO Midstream
| | M&T Bank CorporationLinn Energy, LLC
| Hutchinson Technology, Inc.
| | Juniper Networks, Inc.
| | Macy’s, Inc.
| Hyatt Hotels Corporation
| | Kalsec, Inc.
| | Maersk, Inc.
| Hyundai Motor America
| | Kansas City Southern
| | Magellan Health Services
| IAC/InterActiveCorp
| | Kansas Farm Bureau
| | Mahr Federal, Inc.
| Iasis Healthcare Corporation
| | KAR Holdings, Inc.
| | Malco Products, Inc.
| IBA USA, Inc.
| | KB Home
| | Manitowoc Company, Inc.
| Icahn Enterprises LP
| | KBR, Inc.
| | Mannington Mills, Inc.
| IDT Corporation
| | Keihin Indiana Precision Technology
| | Manpower International, Inc.
| Illinois Tool Works, Inc.
| | Kellogg Company
| | Manpower, Inc.
| Imation Corporation
| | Kelly Services, Inc.
| | ManTech International Corporation
| Imerys
| | Kewaunee Scientific Corporation
| | Marathon Oil Corporation
| IMS Health, Inc.
| | Key Energy Services, Inc.
| | Maricopa County Office of Management
| Indianapolis Power & Light Company
| | KeyCorp
| | & Budget
| Inergy Holdings LP
| | Keystone Automotive Industries
| | Maricopa Integrated Health System
| Information Management Service
| | Keystone Foods Corporation
| | The Mark Travel Corporation
| Ingersoll Rand
| | Kimberly-Clark Corporation
| | Markel Corporation
| Ingles Markets, Incorporated
| | Kindred Healthcare, Inc.
| | Market Planning Solutions, Inc.
| Ingram Industries, Inc.
| | Kinetic Concepts, Inc.
| | Marriott International, Inc.
| Ingram Micro, Inc.
| | Kingston Technology
| | Mars North America
| Inmar, Inc.
| | KLA-Tencor Corporation
| | Marsh & McLennan Companies, Inc.
| Inolex Chemical Company
| | Knight, Inc.
| | Marshall & Ilsley Corporation
| INOVA Health Systems
| | Kohl’s Corporation
| | Marshfield Clinic
| In-Sink-Erator
| | Kraft Foods, Inc.
| | MARTA
| Institute of Nuclear Power Operations
| | The Kroger Company
| | Martin Marietta Materials, Inc.
| Integrys Energy Group, Inc.
| | KrugerCameron International
| | Mary Kay,EXCO Resources, Inc.
| Intel Corporation – EXCO
| | Kyocera America, Inc.M-I SWACO
| Cameron International – Aftermarket | | Masco Corporation
| Interactive Brokers Group, Inc.Permian/Rockies
| | L L Bean, Inc.MCX Exploration (USA), Ltd.
| Cameron International – Centrifugal | | MasseyEdison Mission Energy Company
| International Assets Holding Corporation
| | L-3 Communications Holdings, Inc.
| | MasterCard Incorporated
| International Business Machines Corporation
| | Lab Volt Systems
| | Mattel, Inc.
| International Flavors & Fragrances, Inc.
| | Laboratory Corporation of America Holdings
| | Maui Jim, Inc.
| International Game Technology
| | The Laclede Group, Inc.
| | Maxim Integrated Products, Inc.
| International Paper Company
| | Lake Federal Bank
| | Mayo Clinic
| Interpublic Group of Companies, Inc.
| | Lam Research Corporation
| | The McClatchy Company
| Intertape Polymer Group
| | Lancaster General Hospital
| | McCormick & Company, Incorporated
| Intuit, Inc.
| | Land O’Lakes, Inc.
| | McDonald’s Corporation
| Invacare Corporation
| | Landstar System, Inc.
| | MCG Health, Inc.
| Invensys Controls
| | Lansing Board of Water & Light
| | The McGraw-Hill Companies, Inc.
| Iron Mountain Incorporated
| | Las Vegas Sands Corporation
| | McKesson Medical-Surgical
| The Irvine Company
| | La-Z-Boy Chair Company
| | MD Anderson Cancer Center
| Isuzu Motors America, Inc.
| | Leap Wireless International, Inc.
| | MDU Resources Group, Inc. | Ithaca CollegeCameron International –
| | LearEdison Mission Energy –
| | MDU Resources Group, Inc. – | Compression Systems | | EME Homer City Generation | | WBI Holdings, Inc. | Cameron International – | | Edison Mission Energy – | | Magellan Midstream Holdings, LP | Distributor Valves Division | | Edison Mission O&M | | Magellan Midstream Holdings, LP – | Cameron International – Drilling Systems | | Edison Mission Energy – | | Pipeline/Terminal Division | Cameron International – | | Energy Mission Marketing & Trading | | Magellan Midstream Holdings, LP – | Drilling and Production Systems | | Edison Mission Energy – | | Transportation | Cameron International – | | Midwest Generation EME | | MarkWest Energy Partners LP | Engineered Valves Divison | | Edison Mission Energy – | | MarkWest Energy Partners LP – | Cameron International – Flow Control | | Midwest Generation, LLC | | Gulf Coast Business Unit | Cameron International – | | El Paso Corporation | | MeadWestvacoMarkWest Energy Partners LP –
| Measurement Division | | El Paso Corporation – | | Liberty Business Unit | Cameron International – | | Exploration & Production | | MarkWest Energy Partners LP – | Petreco Process Systems | | El Paso Corporation – | | Northeast Business Unit | Cameron International – | | Pipeline Group | | MarkWest Energy Partners LP – | Process Valves Division | | EnerVest, Ltd. | | Southwest Business Unit | Cameron International – Reciprocating | | Energen Corporation | | Medco Petroleum Management | Cameron International – Subsea Systems | | Energen Corporation – Energen Resources | | Mestena Operating, Ltd. | Cameron International – Surface Systems | | Corporation | | Mirant Corporation | ItochuCameron International – Valves &
| | Energy Future Holdings Corporation | | Mitsui E&P USA LLC | Measurement | | Energy Future Holdings Corporation – | | Modec International Inc. | CenterPoint Energy | | Luminant | | Murphy Oil Corporation | Chesapeake Energy Corporation | | Energy Future Holdings Corporation – | | New York Power Authority | Chesapeake Energy Corporation – CEMI | | TXU Energy | | New York Power Authority – | Chesapeake Energy Corporation – | | Enerplus Resources Fund – Enerplus | | Blenheim-Gilboa Power Project | Chesapeake Midstream Partners | | Resources (USA) Corporation | | New York Power Authority – | Chesapeake Energy Corporation – Compass | | Eni US Operating Company, Inc. | | LeggettClark Energy Center
| Chesapeake Energy Corporation – | | Entegra Power Services, LLC | | New York Power Authority – | Diamond Y | | Equal Energy Ltd. – Altex Energy Corporation | | Niagara Power Project | Chesapeake Energy Corporation – | | Explorer Pipeline Company | | New York Power Authority – | Great Plains | | Exterran | | Richard M. Flynn Power Plant | Chesapeake Energy Corporation – Hodges | | Fasken Oil and Ranch, Ltd. | | New York Power Authority – | Chesapeake Energy Corporation – Midcon | | Forest Oil Corporation | | St. Lawrence/FDR Power Project | Chesapeake Energy Corporation – Nomac | | GE Oil & Platt,Gas Operations LLC – | | Newfield Exploration Company | Cimarex Energy Co. | | PII North America, Inc. | | Medco Health Solutions,Nexen Petroleum USA, Inc.
| Itron,Cinco Natural Resources Corporation
| | Genesis Energy, LLC | | NiSource Inc. | Citation Oil & Gas Corp. | | Global Industries | | NiSource Inc. – Bay State Gas Company | Cleco Corporation | | Great River Energy | | NiSource Inc. – Columbia Gas of Kentucky | Colonial Pipeline Company | | Halliburton Company | | NiSource Inc. – Columbia Gas of Ohio | Constellation Energy Partners LLC | | Helmerich & Payne, Inc. | | Lender Processing Services,NiSource Inc. – Columbia Gas of
| Copano Energy | | Hercules Offshore, Inc. | | Media General, Inc.Pennsylvania
| ITTCrosstex Energy Services
| | Hess Corporation – Exploration & Production | | NiSource Inc. – Columbia Gas of Virginia | DCP Midstream, LLC | | HighMount Exploration & Production LLC | | NiSource Inc. – NiSource Energy | DPL Inc. | | Hilcorp Energy Company | | Technologies | DTE Energy | | Hilcorp Energy Company – | | NiSource Inc. – NiSource Gas | Davis Petroleum Corp. | | Harvest Pipeline Company | | Transmission & Storage | Det Norske Veritas USA | | Holly Corporation | | LennarNiSource Inc. – Northern Indiana
| Devon Energy | | Holly Corporation – Asphalt Company | | Fuel & Light | Dominion Resources, Inc. | | Holly Corporation – Logistic Services | | NiSource Inc. – Northern Indiana Public | Dominion Resources, Inc. – | | Holly Corporation – Navajo Refining | | Service Company | Dominion Energy | | Company | | NiSource Inc. – Transmission Corporation | Dominion Resources, Inc. – | | Holly Corporation – Refining and Marketing | | Nippon Oil Exploration USA Ltd. | Dominion Generation | | Woods Cross | | Noble Corporation | Dominion Resources, Inc. – | | Holly Refining and Marketing Tulsa LLC | | Noble Corporation – Noble Drilling | Dominion Virginia Power | | Hunt Consolidated – Hunt Oil Company | | Services, Inc. | Dresser-Rand Group Inc. | | Husky Energy Inc. | | Noble Energy, Inc. | Dresser-Rand Group Inc. – | | ION Geophysical Corporation | | Meeting Consultants,OGE Energy Corporation
| Dresser-Rand New Equipment | | J-W Operating Company | | ONEOK, Inc. | Dresser-Rand Group, Inc. – | | J-W Operating Company – | | ONEOK, Inc. – Kansas Gas Service Division | Dresser-Rand Product Services | | Cohort Energy Company | | ONEOK, Inc. – ONEOK Energy | Dresser-Rand Group, Inc. –NAO | | J-W Operating Company – | | Services Company | DynMcDermott Petroleum | | J-W Gathering Company | | ONEOK, Inc. – ONEOK Partners | Operations Company | | | Lennox International, Inc.
| | MEMC Electronic Materials, Inc.
|
| | | | | | A-10A-6
| MDU Resources Group, Inc.Proxy Statement |
| | | | | Mercantile Commerce BankONEOK, Inc. – Oklahoma Natural
| | NCI BuildingSuperior Energy Services, Inc. LLC
| | Albemarle Corporation | Gas Division | | Superior Natural Gas Corporation | | Alcoa, Inc. | ONEOK, Inc. – Texas Gas Services Division | | TAQA New World Inc. | | Alfa Laval, Inc. | Occidental Petroleum Corporation – | | TAQA North USA | | Allegheny County Sanitary Authority | Thums Long Beach Company | | TGS-NOPEC Geophysical Company | | Allegheny Energy, Inc. | Oceaneering International, Inc. | | Talisman Energy Inc. US | | Allegheny Technologies, Inc. | Oceaneering International, Inc. – Americas | | Tecpetrol Corporation | | Allegiance Health | Oceaneering International, Inc. – Inspection | | Tellus Operating Group, LLC | | Allergan, Inc. | Oceaneering International, Inc. – Multiflex | | Tesco Corporation | | Allete, Inc. | Oceaneering International, Inc. – OIE | | The Williams Companies, Inc. | | Alliance Data Systems Corporation | PD Holdings Company | | ThermaSource, Inc. | | Alliance Defense Fund | PJM Interconnection | | ThermaSource, Inc. – | | Alliance Residential LLC | PSNC Energy | | ThermsSource Cementing | | Alliant Energy Corporation | Parallel Petroleum LLC | | TransCanada Corporation | | Allstate Corporation | Parker Drilling Company | | TransCanada Corporation – | | Ally Financial, Inc. | Pason Systems USA Corp. | | US Pipeline Central | | Alpha Natural Resources, Inc. | Pepco Holdings, Inc. | | Transocean, Inc. | | ALSAC St. Jude | Petroleum Development Corporation | | Unit Corporation | | Amazon.com, Inc. | Pioneer Drilling Company | | Unit Corporation – | | Ambac Financial Group | Pioneer Natural Resources USA, Inc. | | Superior Pipeline Company, LLC | | Ambius | Plains Exploration & Production Company | | Unit Corporation – Unit Drilling Company | | Ameren Corporation | Pride International | | Unit Corporation – Unit Petroleum Company | | American Cancer Society, Inc. | Puget Sound Energy | | Venoco, Inc. | | American Commercial Lines, Inc. | Questar Corporation | | Verado Energy, Inc. | | American Dehydrated Foods, Inc. | Questar Corporation – QEP Resources | | WGL Holdings, Inc. – Washington Gas | | American Eagle Outfitters, Inc. | Quicksilver Resources Inc. | | XTO Energy, Inc. | | American Electric Power Company | R. Lacy, Inc. – R. Lacy Services, Ltd. | | Xcel Energy Inc. | | American Express Company | RAM Energy Resources, Inc. | | | | American Family Insurance | RKI Exploration & Production, LLC | | Towers Watson 2010/2011 | | American Greetings Corporation | Range Resources Corp. | | Top Management | | American International Group, Inc. | Regency Energy Partners LP | | Compensation Survey | | American National Insurance | Repsol Services Company | | | | American Tire Distributors Holdings, | Resolute Natural Resources Company, LLC | | | | American Tower Corporation | Rosewood Resources, Inc. | | 3M Company | | American University | Rosewood Resources, Inc. – Advanced | | 84 Lumber Company | | American Water | Drilling Technologies | | A. O. Smith Corporation | | AMERIGROUP Corporation | Rowan Companies, Inc. | | AAA | | AmeriPride Services, Inc. | SCANA Corporation | | AAR Corporation | | Ameriprise Financial, Inc. | SCANA Corporation – Carolina Gas | | Aaron’s, Inc. | | AmerisourceBergen Corporation | Transmission Corporation | | Abbott Laboratories | | Ameristar Casinos | SCANA Corporation – SC Electric & Gas | | Abercrombie & Fitch | | Ames True Temper | SandRidge Energy, Inc. | | ABM Industries, Inc. | | AMETEK, Inc. | Schlumberger Limited | | Accident Fund Insurance Company of | | AMETEK, Inc./Advanced Measurement | Science Applications International | | America | | Technologies | Corporation (SAIC) | | Accor North America | | Amgen, Inc. | Seawell Americas, Inc. | | Acme Industries | | Amica Mutual Insurance Company | SemGroup Corporation | | The Actors Fund of America | | Amkor Technology, Inc. | SemGroup Corporation – SemCrude | | Acuity | | Amphenol Corporation | SemGroup Corporation – SemGas | | Acuity Brands, Inc. | | AMR Corporation | SemGroup Corporation – SemStream | | ACUMED LLC | | Anadarko Petroleum Corporation | Seneca Resources Corporation | | Administaff, Inc. | | Analog Devices | Seneca Resources Corporation – Bakersfield | | Adobe Systems, Inc. | | Packaging Corporation of AmericaAnchor Bank NA
| Mercer UniversitySeneca Resources Corporation – Williamsville
| | NCMICADTRAN Incorporated
| | Andersen Corporation | Smith International | | Advance Auto Parts, Inc. | | Andersons, Inc. | SourceGas LLC | | Advanced Micro Devices | | Anixter International, Inc. | Southern Company | | AECOM Technology Corporation | | Annaly Capital Management | Southern Company – | | Aegon USA | | AnnTaylor Stores Corporation | Alabama Power Company | | Aeronix, Inc. | | AOC LLC | Southern Company – Georgia Power | | Aeropostale, Inc. | | Aon Corporation | Southern Company – Gulf Power Company | | AES Corporation | | Apache Corporation | Southern Company – | | Aetna, Inc. | | Apollo Group | Mississippi Power Company | | Affinia Group Intermediate Holdings, Inc. | | Apple, Inc. | Southern Union Company | | AFLAC Incorporated | | Applied Materials, Inc. | Southern Union Company – | | AFP, Inc. | | AptarGroup, Inc. | Missouri Gas Energy | | AGCO Corporation | | ARAMARK Corporation | Southern Union Company – | | Agilent Technologies, Inc. | | Arch Coal, Inc. | New England Gas | | Agilysys, Inc. | | Archstone | Southern Union Company – | | AGL Resources, Inc. | | Armed Forces Insurance | Panhandle Energy | | AgriBank, FCB | | Armstrong World Industries | Southern Union Company – | | Air Products & Chemicals, Inc. | | Arrow Electronics, Inc. | Southern Union Gas Services | | AirTran Holdings, Inc. | | ArvinMeritor, Inc. | Southwestern Energy Company | | Aker Solutions | | Asahi Kasei Plastics NA, Inc. | Sprague Energy Corp. | | AKSteel Holding Corporation | | Asbury Automotive Group, Inc. | Stantec Inc. | | Alaska Air Group, Inc. | | Pactiv Corporation
| Merck & Co., Inc.
| | NCR Corporation
| | Pall Corporation
| Mercury General Corporation
| | Nebraska Public Power District
| | The Pampered Chef
| Merit Medical Systems
| | NetApp, Inc.
| | Panduit Corporation
| MeritCare Health System
| | New Hanover Regional Medical Center
| | Panera LLC
| Merrill Corporation
| | New Jersey Resources Corporation
| | The Pantry, Inc.
| Metals USA, Inc.
| | New York Hotel Trades Council
| | Papa John’s International
| Metavante
| | The New York Times Company
| | Patterson Companies, Inc.
| The Methodist Health Care Corporation
| | Newell Rubbermaid, Inc.
| | Patterson-UTI Energy, Inc.
| MetroPCS Communications, Inc.
| | Newfield Exploration Company
| | Paychex
| Metropolitan Life Insurance Company
| | Newmont Mining Corporation
| | PBS
| Metropolitan Transit Authority
| | NewPage Holding Corporation
| | PC Connection, Inc.
| Mettler-Toledo International, Inc.
| | Nicor Gas
| | Peabody Energy Corporation
| MFS Investment Management
| | Nicor, Inc.
| | Penn National Gaming, Inc.
| MGIC Investment Corporation
| | NII Holdings, Inc.
| | Penn State Hershey Medical Center
| Miami Children’s Hospital
| | NiSource, Inc.
| | Penske AutomotiveAscent Media Group Inc.
| Michael Baker Corporation
| | Nissan North America
| | Pentair, Inc.
| Michael Foods, Inc.
| | Nissin Foods (USA) Co., Inc.
| | The Pep Boys – Manny, Moe & Jack
| Michaels Stores, Inc.
| | NJM Insurance Group
| | Pepco Holdings, Inc.
| Micron Technology, Inc.
| | Noble Energy, Inc.
| | The Pepsi Bottling Group, Inc.
| MidAmerican Energy Company
| | Norcal Waste Systems, Inc.
| | PepsiAmericas, Inc.
| Midwest Research Institute
| | Nordson Corporation
| | PepsiCo, Inc.
| Mike Albert Leasing, Inc.
| | Nordstrom
| | Perini Corporation
| Millennium Inorganic Chemicals
| | Nordstrom, Inc.
| | PerkinElmer, Inc.
| MillerCoors
| | Norfolk Southern Corporation
| | Perot System
| Minco Products, Inc.
| | North American Hoganas
| | Perrigo Company
| Mine Safety Appliances Company
| | North Texas Tollway Authority
| | PetSmart, Inc.
| Miniature Precision Components, Inc.
| | Northeast Utilities System
| | Pfizer, Inc.
| Minntech Corporation
| | Northern Trust Corporation
| | PG&E Corporation
| Mirant Corporation
| | Northrop Grumman Corporation
| | PGT Industries
| Missouri Department of Conservation
| | Northwestern Mutual Life Insurance
| | Phacil, Inc.
| Missouri Department of Transportation
| | Norton Health Care
| | Pharmavite LLC
| Mitsubishi International Corporation
| | NRUCFC
| | PharMerica Corporation
| Mitsui & Company USA, Inc.
| | NSK Corporation
| | PHH Arval
| MMS Consultants, Inc.
| | NSTAR
| | PHH Corporation
| Mohawk Industries
| | NTK Holdings, Inc.
| | PHI, Inc.
| Mohegan Sun Casino
| | Nucor Corporation
| | Philip Morris International, Inc.
| Molex, Inc.
| | NuStar Energy LP
| | Phillips-Van Heusen Corporation
| Molina Healthcare, Inc.
| | NV Energy, Inc.
| | The Phoenix Companies, Inc.
| Molson Coors Brewing Company
| | NVIDIA Corporation
| | Piedmont Natural Gas Company, Inc.
| Moneris Solutions Corporation
| | NVR, Inc.
| | Pinnacle West Capital Corporation
| Monsanto Company
| | NYSE Euronext
| | Pioneer Electronics (USA), Inc.
| Moody’s Corporation
| | O’Reilly Automotive, Inc.
| | Pioneer Natural Resources
| Moog, Inc.
| | Occidental Petroleum Corporation
| | Pitney Bowes
| Morgan Stanley
| | Oceaneering International
| | Plains All American Pipeline LP
| Motorola, Inc.
| | Office Depot, Inc.
| | Plains Exploration & Production Company
| MPS Group, Inc.
| | OfficeMax
| | The Planet Internet Services
| MSC Industrial Direct
| | OGE Energy Corporation
| | Plexus Corporation
| MTA Long Island Bus
| | Ohio Public Employees Retirement System
| | Plymouth Tube
| MTD Products, Inc.
| | Ohio State University
| | PM Company
| MTS System Corporation
| | Ohio State University Medical Center
| | The PNC Financial Services Group, Inc.
| Mueller Industries, Inc.
| | Oil States International, Inc.
| | PNM Resources, Inc.
| Mueller Water Products, Inc.
| | Oil-Dri Corporation of America
| | Polaris Industries, Inc.
| Murphy Oil Corporation
| | Old Dominion Electric Cooperative
| | PolyOne Corporation
| Mutual of Enumclaw Insurance Company
| | Old Republic International Corporation
| | Pool Corporation
| Mutual of Omaha
| | Olin Corporation
| | Popular, Inc.
| Mylan, Inc.
| | OM Group, Inc.
| | Port of Portland
| NACCO Industries, Inc.
| | Omnicare, Inc.
| | Portland General Electric Company
| Nalco Company
| | Omnicom Group, Inc.
| | PPG Industries, Inc.
| NASDAQ OMX Group, Inc.
| | ON Semiconductor Corporation
| | PPL Corporation
| Nash-Finch Company
| | Oncology Nursing Society
| | Praxair, Inc.
| National Academies
| | Oncor Electric Delivery
| | Preformed Line Products Company
| National Fuel Gas Company
| | ONEOK, Inc.
| | Premera Blue Cross
| National Futures Association
| | Orbital Science Corporation
| | Premier, Inc.
| National Interstate Insurance Company
| | Oregon State Lottery
| | Price Chopper/Golub Corporation
| National Radio Astronomy Observatory
| | Oriental Trading Company
| | priceline.com Incorporated
| National Safety Council
| | OSG Tap & Die, Inc.
| | Pride International, Inc.
| National Tobacco Company
| | Oshkosh Corporation
| | Prince William Health System
| National-Oilwell Varco, Inc.
| | Owens & Minor, Inc.
| | Principal Financial Group, Inc.
| Nature’s Sunshine Products, Inc.
| | Owens Corning
| | Pro Staff
| Navistar International Corporation
| | Owens-Illinois, Inc.
| | Probuild Holdings, Inc.
| Navy Exchange Service Command
| | Oxford Industries
| | Progress Energy, Inc.
| NBTY, Inc.
| | PACCAR, Inc.
| | The Progressive Corporation
| NCCI Holdings, Inc.
| | Pacer International, Inc.
| | Project Management Institute
|
| | | | | | MDU Resources Group, Inc.Proxy Statement | A-11A-7
|
| | | | | ProLogisASCO – Valve
| | Safeway,Boeing Company
| | ConnectiCare Capital LLC | Ash Grove Cement Company | | Boise Cascade Holdings LLC | | Conocophillips | Ashland, Inc. | | Southern Union CompanyBoise, Inc.
| | Consol Energy, Inc. | Protective LifeAsset Marketing Service, Inc.
| | Bon-Ton Stores, Inc. | | Consolidated Edison, Inc. | Assurant, Inc. | | Borders Group, Inc. | | Constellation Energy | Asurion Corporation | | SafiloBorg Warner
| | Continental Airlines, Inc. | AT&T, Inc. | | Bosch Packaging Services | | Continental Data Graphics | Atlas Energy, Inc. | | Bosch Rexroth Corporation | | Convergys Corporation | Atmos Energy Corporation | | Boston Scientific Corporation | | Con-Way | Aurora Healthcare | | Boy Scouts of America | | Cook Communications Ministries | The Auto Club Group | | Boyd Gaming Corporate | | Cooper Tire & Rubber Company | Autodesk, Inc. | | Bradley Corporation | | Cooper-Standard Holdings, Inc. | Autoliv, Inc. | | Brady Corporation | | CooperVision, Inc. | Automobile Club of Southern California | | Bridgepoint Education | | Core Mark Holding Company, Inc. | AutoNation, Inc. | | Briggs & Stratton Corporation | | Corinthian Colleges | AutoZone, Inc. | | Brightpoint, Inc. | | Corn Products International, Inc. | Avery Dennison Corporation | | Brinks Company | | Cornell University | Avis Budget Group | | Bristol-Myers Squibb Company | | Corning, Inc. | Avista Corporation | | Broadcom Corporation | | Correctional Medical Services | Avon Products, Inc. | | Broadlane, Inc. | | Corrections Corporation of America | Axsys | | Broadridge Financial Solutions | | Costco Wholesale Corporation | B Braun Medical, Inc. | | Brocade Communications Systems | | Country Insurance & Financial | B/E Aerospace, Inc. | | Brookdale Senior Living | | Country of Spotsylvania | Babson College | | Brown Shoe Company, Inc. | | Covance, Inc. | Baker Hughes, Inc. | | Brownells, Inc. | | Covanta Holding Corporation | Baldor Electric Company | | Brown-Forman Corporation | | Coventry Health Care, Inc. | Ball Corporation | | Brunswick Corporation | | CPS Energy | Bank of America Corporation | | Bryant University | | Cracker Barrel Old Country Store, Inc. | Bank of New York Mellon Corporation | | BSSI | | Crane Company | Baptist Health | | Bucyrus International, Inc. | | Crosstex Energy, Inc. | Barilla America, Inc. | | Buffets, Inc. | | Crown Castle International Corporation | Barloworld Handling | | Burger King Holdings, Inc. | | CSX Corporation | Basler Electric Company | | C H Robinson Worldwide, Inc. | | CTS Corporation | Baxter International, Inc. | | C.R. Bard, Inc. | | Cultural Institute Retirement System | Baylor College of Medicine | | Cabelas, Inc. | | Cummins, Inc. | Baylor Health Care System | | Cablevision Systems Corporation | | CUNA Mutual Group | BB&T Corporation | | Cabot Corporation | | Curtiss Wright Corporation | Beacon Roofing Supply, Inc. | | Caci International, Inc. | | CVREnergy, Inc. | Bechtel Systems & Infrastructure, Inc. | | Caelum Research Corporation | | CVS Caremark | Beckman Coulter, Inc. | | California Casualty Management Company | | Cytec Industries, Inc. | Becton Dickinson & Company | | California Dental Association | | D R Horton, Inc. | Belk, Inc. | | Calpine Corporation | | Daimler Financial Services | Bemis Company, Inc. | | Calumet Specialty Products Partners LP | | Dallas County | Bemis Manufacturing Company | | Cameron International Corporation | | Dal-Tile, Inc. | Benchmark Electronics, Inc. | | Campbell Soup Company | | Dana Holding Corporation | The Bergquist Company | | Career Education Corporation | | Danaher Corporation | Berkshire Hathaway | | Carhartt, Inc. | | Data Center, Inc. | Berry Plastics Corporation | | CaridianBCT, Inc. | | DaVita, Inc. | Berwick Offray LLC | | Carlisle Cos, Inc. | | Dean Foods Company | Best Buy Company, Inc. | | Carlson Companies, Inc. | | The Decurion Corporation | Big Lots, Inc. | | CarMax | | Deere & Company | Bimbo Bakeries USA | | Southwest AirlinesCarpenter Technology Corporation
| | Dekalb Regional Healthcare Systems | Biodynamic Research Corporation | | Carter | | Delta Air Lines, Inc. | Biogen Idec, Inc. | | Carter’s, Inc. | | Delta Dental Plan of Michigan | Biomet | | Catalyst Health Solutions | | Deluxe Corporation | Bio-Rad Laboratories, Inc. | | Caterpillar, Inc. | | Denny’s, Inc. | BJ Services Company | | CB Richard Ellis | | Denso International America | BJ’s Wholesale Club, Inc. | | CBS Corporation | | DENTSPLY International, Inc. | Black Hills Corporation | | CC Media Holdings, Inc. | | DePaul University | Blackrock, Inc. | | CDM | | Devon Energy Corporation | Blackstone Group LP | | CEC Entertainment, Inc. | | Dex One Corporation | Blockbuster, Inc. | | CEI | | DFW International Airport | Blue Cross Northeastern Pennsylvania | | Celanese Corporation | | Dick’s Sporting Goods, Inc. | Blue Cross of Idaho Health Service, Inc. | | Celgard, Inc. | | Dickstein Shapiro LLP | BlueCross BlueShield of Arizona | | Celgene Corporation | | Diebold, Inc. | BlueCross BlueShield of Delaware | | CEMEX, Inc. | | Dillards, Inc. | BlueCross BlueShield of Louisiana | | Centene Corporation | | DIRECTV | BlueCross BlueShield of Nebraska | | Comcast Corporation | | Discover Financial Services, Inc. | BlueCross BlueShield of South Carolina | | Comerica, Inc. | | Discovery Communications, Inc. | BlueCross BlueShield of Tennessee | | Commercial Metals | | DISH Network | Bluelinx Holdings, Inc. | | CommScope, Inc. | | Diversey, Inc. | BMW Manufacturing Corporation | | Community Coffee Company LLC | | Doherty Employer Services | Board of Governors of the | | Community Health Systems, Inc. | | Dole Food Company, Inc. | Federal Reserve System | | The Community Preservation Corporation | | Dollar General Corporation | The Body Shop | | Computer Task Group | | Dollar Thrifty Automotive Group |
| | | | | | A-8 | MDU Resources Group, Inc. Proxy Statement |
| | | | | Dominion Resources, Inc. | | Federal Reserve Bank of Chicago | | Gilbarco, Inc. | Donaldson Company, Inc. | | Federal Reserve Bank of Cleveland | | Gilead Sciences, Inc. | Dover Corporation | | Federal Reserve Bank of Dallas | | Glatfelter Company | PrudentialDow Chemical
| | Federal Reserve Bank of Kansas City | | The Gleason Works | DPL, Inc. | | Federal Reserve Bank of Minneapolis | | Global Partners LP | Dr. Pepper Snapple Group, Inc. | | Federal Reserve Bank of Philadelphia | | GOJO Industries, Inc. | Dresser-Rand Group, Inc. | | Federal Reserve Bank of San Francisco | | Gold Eagle Company | DST Systems, Inc. | | Federal Reserve Bank of St. Louis | | Goldman Sachs Group, Inc. | DTE Energy | | FedEx Express | | Goodman Manufacturing | Duane Reade Holdings, Inc. | | FedEx Ground | | Goodrich Corporation | Duke Energy Corporation | | FedEx Office | | Goodyear Tire & Rubber Company | Duke Realty Corporation | | Fender Musical Instruments | | Google, Inc. | Duke University & Health System | | Ferguson Enterprises | | Graco, Inc. | Dun & Bradstreet Corporation | | Fermi National Accelerator Laboratory | | Graham Packaging Company, Inc. | DuPont | | FerrellGas, Inc. | | Grande Cheese Company | Dupont Fabros Technology | | Ferro Corporation | | Grange Mutual Insurance Company | Dyn McDermott | | Fiberweb | | Granite Construction, Inc. | Dynegy, Inc. | | Fidelity National Financial | | Graphic Packaging Holding Company | E TRADE Financial Corporation | | Fidelity National Information Services | | Graybar Electric Company, Inc. | Early Warning Services | | Fifth Third Bancorp | | Great American Insurance/Great | Eastman Chemical Company | | The First American Corporation | | American Financial | Eastman Kodak Company | | First Bank | | Great Plains Energy, Inc. | Eaton Corporation | | First Citizens Bank | | Greenheck Fan Corporation | eBay, Inc. | | First Horizon National Corporation | | Greif, Inc. | Echostar Corporation | | First Solar, Inc. | | Greyhound Lines, Inc. | Ecolab, Inc. | | FirstEnergy Corporation | | Grinnell Mutual Reinsurance Company | Edison Mission Energy | | Fiserv, Inc. | | Group 1 Automotive, Inc. | Edward Jones & Company | | Fleetwood Group | | Grow Financial Federal Credit Union | Edwards Lifesciences | | Flexcon Company, Inc. | | Growmark, Inc. | Einstein Noah Restaurant Group | | Flexible Steel Lacing Company | | GTECH Corporation | El Paso Corporation | | Florida Power & Light Company | | GuideStone Financial Resources | Electrolux Homecare of North America | | Flowers Foods, Inc. | | Habitat for Humanity International | Eli Lilly & Company | | Flowserve Corporation | | Halliburton Company | Elizabeth Arden, Inc. | | Fluor Corporation | | Hancock Holdings Company | EMC Corporation | | FMC Corporation | | Hanesbrands, Inc. | EMCOR Group, Inc. | | FMC Technologies, Inc. | | Hannaford Bros. Company | Emerson Climate Technologies, Inc. | | Follett Corporation | | Hanover Insurance Group, Inc. | Emerson Electric | | Foot Locker, Inc. | | Hapag-Lloyd (America), Inc. | Enbridge Energy Partners LP | | Ford Motor Company | | Harley Davidson Motor Company | Energizer Holdings, Inc. | | Fortune Brands | | Harman International Industries | Energy Enterprise Solutions LLC | | Fossil, Inc. | | Harrahs Entertainment, Inc. | Energy Future Holdings | | Foster Poultry Farms | | Harris County Hospital District | Energy Transfer Equity LP | | Foundation for California | | Harsco Corporation | EnergySolutions, Inc. | | Community Colleges | | Hartford Financial Services | Enpro Industries (Fairbanks Morse Engine) | | Franklin Resources, Inc. | | Harvard Vanguard Medical Associates | Entergy Corporation | | Franklin W. Olin College of Engineering | | Harvey Industries | Enterprise GP Holdings LP | | Freeman Dallas Corporate Office | | Hasbro, Inc. | EOG Resources, Inc. | | Freeport-McMoRan Copper & Gold, Inc. | | Hastings Mutual Insurance Company | EON US LLC | | Fremont Group | | Hawaiian Electric Industries, Inc. | Equifax, Inc. | | Friendly Ice Cream Corporation | | Haynes & Boone LLP | Equity Residential | | Froedtert & Community Health | | Hayward Industries, Inc. | Erickson Retirement Communities | | Frontier Communications Corporation | | Hazelden Foundation | Erie Insurance Group | | Frontier Oil Corporation | | HCA, Inc. | ESCO Corporation | | Funeral Directors Life Insurance Company | | HCC Insurance Holdings, Inc. | ESCO Technologies | | G&K Services | | HD Supply, Inc. | Esterline Technologies Corporation | | Gallagher Arthur J & Company | | HDR, Inc. | Etnyre International, Ltd. | | Gannett Company | | Health Care Service Corporation | Evraz, Inc. | | Gap, Inc. | | Health Management Association | Exel, Inc. | | Gardner Denver, Inc. | | Health Net | Exelon Corporation | | Gas Technology Institute | | Health Partners | Exempla Health Care, Inc. | | Gaylord Entertainment | | Health Plus of Michigan | Exide Technologies | | General Cable Corporation | | HealthNow New York | Expedia, Inc. | | General Dynamics Corporation | | HealthSouth Corporation | Express Scripts, Inc. | | General Dynamics Information Technology | | HealthSpring, Inc. | Exterran Holdings, Inc. | | General Electric Company | | Heartland Food Corporation | Extra Space Storage | | General Nutrition, Inc. | | Heartland Payment Systems, Inc. | Exxon Mobil Corporation | | Genesis Energy | | Heat Transfer Research, Inc. | FAIR Plan Insurance Placement | | Gentiva Health Services | | Helmerich & Payne, Inc. | Facility of Pennsylvania | | Genuine Parts Company | | Hendrick Medical Center | Fairfield Manufacturing | | Genworth Financial, Inc. | | Sage SoftwareHendrickson International
| Family Dollar Stores | | Southwest GasGenzyme Corporation
| | Henry Ford Health System | Fannie Mae | | Georg Fischer Signet LLC | | Hercules Offshore | Farmland Foods, Inc. | | Georgia Gulf Corporation | | Herman Miller, Inc. | Fastenal Company | | Georgia Institute of Technology | | Hershey Company | Federal Reserve Bank of Boston | | Gerdau Ameristeel | | Hertz Global Holdings, Inc. |
| | | | MDU Resources Group, Inc. Proxy Statement | A-9 |
| | | | | Hess Corporation | | ITT Corporation | | Legal & General America | Hewitt Associates, Inc. | | ITT Industries – AES | | Leggett & Platt, Inc. | Hewlett-Packard Company | | J J Keller & Associates, Inc. | | Lender Processing Services | Hexion Specialty Chemicals, Inc. | | J R Simplot Company | | Lennar Corporation | High Industries, Inc. | | J&J Worldwide Services | | Lennox International, Inc. | Highmark, Inc. | | J.C. Penney Company | | Level 3 Communications, Inc. | Hill Phoenix | | Jabil Circuit, Inc. | | Levi Strauss & Company | Hilti, Inc. | | Jack In The Box, Inc. | | Lexmark International, Inc. | Hitachi America, Ltd. | | Jacobs Engineering Group, Inc. | | Liberty Global, Inc. | HNI Corporation | | Jacobs Technology, Inc. | | Liberty Media Corporation | HNTB Corporation | | James Hardie Building Products | | Lieberman Research Worldwide | Holden Industries, Inc. | | Jarden Corporation | | Life Technologies Corporation | Holly Corporation | | JB Hunt Transport Services, Inc. | | Lifepoint Hospitals, Inc. | Hologic, Inc. | | Jet Blue Airways | | Limited Brands | Home Depot, Inc. | | JM Family Enterprises | | Lincare Holdings, Inc. | Home Shopping Network | | Jo-Ann Stores, Inc. | | Lincoln Electric Holdings, Inc. | Honeywell International, Inc. | | John Crane, Inc. | | Lincoln National Corporation | Horizon Blue Cross Blue Shield | | John Wiley & Sons, Inc. | | Lithia Motors, Inc. | Hormel Foods Corporation | | Johns Hopkins University | | Littelfuse, Inc. | Hospira, Inc. | | Johnson & Johnson | | Little Lady Foods | Host Hotels & Resorts, Inc. | | Johnson Controls, Inc. | | Live Nation Entertainment, Inc. | Hostess Brands | | Johnson Financial Group | | Liz Claiborne | Hot Topic, Inc. | | Jones Apparel Group, Inc. | | LKQ Corporation | Hubbell, Inc. | | Jones Financial Companies LLLP | | Lockheed Martin Corporation | Hudson City Bancorp, Inc. | | Jones Lang LaSalle | | Loews Corporation | Hu-Friedy Manufacturing Company, Inc. | | Jostens, Inc. | | Lorillard, Inc. | Humana, Inc. | | Joy Global, Inc. | | Los Angeles Unified School District | Hunter Industries | | JPMorgan Chase & Company | | Louisiana Pacific | Huntington Bancshares | | Judicial Council of California | | Lowe’s Companies, Inc. | Huntsman Corporation | | Juniper Networks, Inc. | | Lower Colorado River Authority | Huron Consulting Group | | K Hovnanian Companies LLC | | Lozier Corporation | Hutchinson Technology Incorporated | | Kalsec, Inc. | | LPL Investment Holdings, Inc. | Hyatt Hotels Corporation | | Kansas Farm Bureau | | LSG Sky Chefs | Hyundai Motor Manufacturing of Alabama | | KAR Auction Services, Inc. | | LSI Corporation | IAC/Interactivecorp | | Katun Corporation | | Lubrizol Corporation | Icahn Enterprises LP | | KB Home | | Lufthansa AirPlus Servicekarten GmbH | IDEX Corporation | | KBR, Inc. | | Luther Midelfort-Mayo Health System | IDEXX Laboratories, Inc. | | Keihin North America | | Lutron Electronics | IDT Corporation | | Kellogg Company | | Luxottica Retail | IKON Office Solutions | | Kelly Services, Inc. | | M & F Worldwide Corporation | Illinois Tool Works, Inc. | | Kettering University | | M & T Bank Corporation | Imation Corporation | | Kewaunee Scientific Corporation | | Macy’s, Inc. | IMS Health, Inc. | | Keycorp | | Magellan Health Services | Indiana Farm Bureau Insurance | | Keystone Automotive Industries | | Magna Seating Systems Engineering | Inergy Holdings LP | | Keystone Foods Corporation | | Malco Products, Inc. | Information Management Service | | KI, Inc. | | Malt-O-Meal | Ingersoll Rand | | Kimberly-Clark Corporation | | Manitowoc Company | Ingles Markets, Inc. | | Kimley-Horn and Associates, Inc. | | MANN+HUMMEL USA, Inc. | Ingram Industries, Inc. | | Kinder Morgan Energy | | Manpower International, Inc. | Ingram Micro, Inc. | | Kindred Healthcare | | Manpower, Inc. | Insight Enterprises, Inc. | | Kinetic Concepts, Inc. | | ManTech International | In-Sink-Erator | | King Pharmaceuticals, Inc. | | MAPFRE USA, Corporation | Institute for Defense Analyses | | Kingston Technology | | Marathon Oil Corporation | Institute of Nuclear Power Operations | | Klein Tools | | Maricopa County Office of | Insurance Auto Auctions | | Kohler Company | | Management & Budget | Integrys Energy Group, Inc. | | Kohls Corporation | | Maricopa Integrated Health System | Intel Corporation | | Komatsu America Corporation | | Maritz, Inc. | Interbake Foods, Inc. | | Kraft Foods, Inc. | | Markel Corporation | InterMetro Industries Corporation | | L. L. Bean, Inc. | | Market Planning Solutions, Inc. | International Assets Holding Company | | L-3 Communications Holdings, Inc. | | Marriott International, Inc. | International Business Machines Corporation | | L-3 Communications, Global Security & | | Mars North America | International Dairy Queen, Inc. | | Engineering Solutions | | Marsh & McLennan Companies | International Flavors & Fragrances | | La Macchia Enterprises | | Marshall & Ilsley Corporation | International Game Technology | | Lab Volt Systems | | Marshfield Clinic | International Paper Company | | Laboratory Corporation of America Holdings | | MARTA | Interpublic Group of Companies | | Laclede Group, Inc. | | Martin Marietta Materials, Inc. | Intertape Polymer Group | | Lake Federal Bank | | Mary Kay, Inc. | Intuit, Inc. | | Lake Forest Academy | | Maryland Department of Transportation | Invacare Corporation | | Lake Region Medical | | Masco Corporation | Invensys Controls | | Lance, Inc. | | Massey Energy Company | Iron Mountain Canada Corporation | | Landstar System, Inc. | | MasTec, Inc. | The Irvine Company | | Lantech.com | | Master Halco | Ithaca College | | Las Vegas Sands Corporation | | Mattel, Inc. | Itochu International, Inc. | | Leap Wireless International, Inc. | | Maxim Integrated Products, Inc. | Itron, Inc. | | Lear Corporation | | Mayo Clinic |
| | | | A-10 | MDU Resources Group, Inc. Proxy Statement |
| | | | | McAfee, Inc. | | Nature’s Sunshine Products, Inc. | | Packaging Corporation of America | McCormick & Company, Inc. | | Navistar International Corporation | | Pactiv Corporation | McDonald’s Corporation | | Navy Exchange Service Command | | Pall Corporation | MCG Health, Inc. | | NBTY, Inc. | | The Pampered Chef | McGraw-Hill Companies | | NCCI Holdings, Inc. | | Panduit Corporation | McKesson Medical-Surgical | | NCR Corporation | | Pantry, Inc. | MDU Resources Group, Inc. (WBI Holdings) | | Nebraska Public Power District | | Papa John’s International | MeadWestvaco Corporation | | Neiman Marcus | | Parsons Child & Family Center | Mecklenburg County | | Netflix, Inc. | | Patterson Companies, Inc. | Medco Health Solutions, Inc. | | New Jersey Resources Corporation | | PC Connection, Inc. | Media General, Inc. | | New York Times Company | | Peabody Energy Corporation | Medline Industries | | Newell Rubbermaid, Inc. | | Pearson Education | Men’s Wearhouse, Inc. | | Newmont Mining Corporation | | Penn National Gaming, Inc. | Mercer University | | NewPage Corporation | | Penn State Hershey Medical Center | Merck & Company | | Nicor Gas | | Penske Automotive Group, Inc. | Mercury General Corporation | | Nicor, Inc. | | Pentair, Inc. | Merit Medical Systems | | The Nielsen Company | | Pep Boys–Manny Moe & Jack | MeritCare Health System | | NII Holdings, Inc. | | Pepco Holdings, Inc. | Merrill Corporation | | NiSource Corporate Services | | Pepsi Bottling Group, Inc. | The Methodist Hospital | | Nissin Foods (USA) Company, Inc. | | PepsiCo, Inc. | MetroPCS Communications, Inc. | | NJM Insurance Group | | Perkinelmer, Inc. | Metropolitan Life Insurance Company | | Noble Energy, Inc. | | Petsmart, Inc. | Metropolitan Transit Authority | | The Nordam Group | | Pfizer, Inc. | Mettler-Toledo International, Inc. | | Nordson Corporation | | PG&E Corporation | MFS Investment Management | | Nordstrom | | Pharmavite LLC | MGIC Investment Corporation | | Nordstrom, Inc. | | Pharmerica Corporation | MGM Mirage | | Norfolk Southern Corporation | | PHH Arval | Miami Children’s Hospital | | North Carolina State Employees’ Credit Union | | PHH Corporation | Miami Dade Community College | | North Texas Tollway Authority | | PHI, Inc. | Michael Baker Corporation | | Northeast Utilities | | Philip Morris International, Inc. | Michael Foods, Inc. | | Northern Trust Corporation | | Phillips – Van Heusen Corporation | Michaels Stores, Inc. | | Northrop Grumman Corporation | | Phoenix Companies, Inc. | Micron Technology, Inc. | | Northwestern Mutual | | Picerne Military Housing | Midwest Research Institute | | NovaMed Corporation | | Piedmont Natural Gas Company, Inc. | Mike Albert Leasing, Inc. | | NRG Energy, Inc. | | Pier 1 Imports | Millennium Inorganic Chemicals | | NRUCFC | | Pilgrim’s Pride Corporation | Mine Safety Appliances Company | | Nstar | | Pinnacle Airlines | Minnesota Management & Budget | | Nucor Corporation | | Pinnacle Foods Finance LLC | Mirant Corporation | | NuStar Energy LP | | Pinnacle West Capital Corporation | Mission Foods | | NV Energy, Inc. | | Pinnacol Assurance | Missouri Department of Conservation | | NVIDIA Corporation | | Pioneer Natural Resources Company | Missouri Department of Transportation | | NVR, Inc. | | Pitney Bowes, Inc. | Mitsubishi International Corporation | | NYSE Euronext | | Plains All American Pipeline LP | Mitsubishi Motor Manufacturing | | O’Reilly Automotive, Inc. | | Plexus Corporation | MMS Consultants, Inc. | | Occidental Petroleum Corporation | | PM Company | Mohawk Industries | | Oceaneering International | | PNC Financial Services Group, Inc. | Mohegan Sun Casino | | Oerlikon Balzers Coating USA, Inc. | | PNM Resources, Inc. | Molex, Inc. | | Office Depot, Inc. | | Polaris Industries, Inc. | Molina Health Care, Inc. | | OfficeMax | | Polymer Technologies | Molson Coors Brewing Company | | OGE Energy Corporation | | Polyone Corporation | Momentive Performance Materials, Inc. | | Ohio Public Employees Retirement System | | Popular, Inc. | Monsanto Company | | Ohio State University | | Port Authority of Allegheny County | Moody’s Corporation | | The Ohio State University Medical Center | | Port of Portland | Moog, Inc. | | Ohio University | | Portland General Electric Company | Morgan Stanley | | OHL | | Poudre Valley Health Systems | Motorola, Inc. | | Oil States International, Inc. | | PPG Industries, Inc. | MTA Long Island Bus | | Oil-Dri Corporation of America | | PPL Corporation | MTD Products, Inc. | | Old Dominion Electric Cooperative | | Praxair, Inc. | MTS System Corporation | | Old Republic Companies | | Preformed Line Products Company | Mueller Industries, Inc. | | Omnicare, Inc. | | Premera Blue Cross | Murphy Oil Corporation | | Omnicom Group | | Priceline.com, Inc. | Mutual of Enumclaw Insurance Company | | Omnova Solutions, Inc. | | Pride International, Inc. | Mutual of Omaha | | ON Semiconductor Corporation | | Prince William Health System | Mylan, Inc. | | ONEOK, Inc. | | Principal Financial Group, Inc. | NACCO Industries, Inc. | | The Oppenheimer Group | | Probuild Holdings, Inc. | Nalco Holding Company | | Orange County Government | | Progress Energy, Inc. | NASDAQ OMX Group, Inc. | | Orbital Science Corporation | | Progressive Corporation | Nash Finch Company | | Oregon State Lottery | | Project Management Institute | National Academies | | Oshkosh Corporation | | Property Casualty Insurers Association | National Fuel Gas Company | | Owens & Minor, Inc. | | of America | National Futures Association | | Owens Corning | | Protective Life Corporation | National Interstate Insurance Company | | Owens-Illinois, Inc. | | Prudential Financial, Inc. | National Oilwell Varco, Inc. | | Oxford Industries | | Psion Teklogix, Inc. | National Safety Council | | PACCAR, Inc. | | Psychiatric Solutions, Inc. | National Tobacco Company | | Pacer International, Inc. | | Public Service Enterprise Group, Inc. |
| | | | MDU Resources Group, Inc. Proxy Statement | A-11 |
| | | | | Public Storage | | SAIC, Inc. | | Southwestern EnergySonoco Products Company
| Public Service Enterprise Group, Inc.
| | Saint Vincent Catholic Medical Centers
| | Sovereign Bank
| Public Storage
| | Saks Incorporated
| | Space Telescope Science Institute
| Public Utility District #1 of Chelan County | | Sakura Finetek USA,Saks, Inc.
| | Sparrow Health SystemSource Interlink Companies, Inc.
| Publix Super Markets, Inc. | | Salk InstituteSakura Finetek USA, Inc.
| | Spectra Energy CorporationSouth Jersey Gas Company
| Puget Energy, Inc. | | Sally Beauty CompanySalk Institute
| | Spectrum Brands,Southco, Inc.
| Pulte Homes,Pultegroup, Inc.
| | Sally Beauty Holdings, Inc. | | Southeastern Freight Lines | QSC Audio Products, Inc. | | Salt River Project | | Spectrum Health – DowntownSouthern Company
| QBE Regional InsuranceQTI Human Resources
| | Samuel Roberts Noble Foundation | | Spherion CorporationSouthern Poverty Law Center
| Qdoba Restaurant CorporationQualcomm, Inc.
| | San Antonio Water System | | Springs Global US, Inc.Southern Union Company
| QTI Human ResourcesQuality Bicycle Products
| | San Manuel Band of Mission Indians | | Springs Window Fashions DivisionSouthwest Airlines
| Qualcomm,Quanta Services, Inc.
| | Sanderson Farms, Inc. | | Sprint NextelSouthwest Gas Corporation
| Quality Bicycle ProductsQuest Diagnostics Incorporated
| | SanDiskSandisk Corporation
| | SPX Corporation
| Quanta Services, Inc.
| | Sandoz, Inc.
| | SRA International, Inc.
| Quest Diagnostics, Inc.
| | Sanmina-SCI Corporation
| | St. Cloud HospitalSouthwestern Energy Company
| Questar Corporation | | Sargent Fletcher, Inc.Sanmina-Sci Corporation
| | St. Jude Medical, Inc.Space Dynamics Lab
| Quiksilver, Inc. | | SAS Institute, Inc. | | St. Louis County GovernmentSpace Telescope Science Institute
| Quorum Health ResourcesQwest Communications International, Inc.
| | Sauer-Danfoss, Inc. | | St. Mary’s at AmsterdamSpectra Energy Corporation
| Qwest Communications International, Inc.R L I Insurance Company
| | Savannah River Nuclear Solutions LLC | | Stamats Communications, Inc.
| R H Donnelly
| | SavaSeniorCare Administrative Services
| | Stampin’ Up!
| R L I Insurance Company
| | SCANA Corporation
| | StanCorp Financial Group,Spectrum Brands, Inc.
| R L Polk & Company | | ScanSource,Save Mart
| | Spectrum Group International, Inc. | Radio One | | SCANA Corporation | | Spectrum Health – Downtown | Radioshack Corporation | | Scansource, Inc. | | Standard Aero LimitedSprint Nextel Corporation
| RackspaceRalcorp Holdings, Inc.
| | SCF Arizona | | SPX Corporation | The Raymond Corporation | | Schaumburg Township District Library | | Standard Motor Products, Inc.St. Cloud Hospital
| Radian Group,Raymond James Financial
| | Schein Henry, Inc. | | Schering-Plough Corporation
| | Standard Pacific HomesSt. John Health System
| Radio OneRaytheon Company
| | Schneider Electric | | The Stanley WorksSt. Jude Children’s Research Hospital
| Radio ShackREA Magnet Wire Company, Inc.
| | Schneider National, Inc. | | St. Jude Medical, Inc. | Realogy Corporation | | Schnitzer Steel Industries Inc. | | Staples, Inc.St. Louis County Government
| Ralcorp Holdings, Inc.
| | Schreiber Foods, Inc.
| | Starbucks Corporation
| The Raymond CorporationRecology
| | Schwan Food Company | | Starwood Hotels & Resorts Worldwide, Inc.St. Luke’s Episcopal Health System
| Raymond James Financial, Inc.
| | Scottrade, Inc.
| | State Corporation Commission
| RaytheonRed Wing Shoe Company
| | Scientific Research Corporation | | St. Mary’s at Amsterdam | Redcats USA | | The Scooter Store | | St. Vincent Hospital | Regal Entertainment Group | | Scott & White Hospital | | Stampin’ Up! | Regal-Beloit | | Scotts Miracle-Gro Company | | State Employee Credit UnionStancorp Financial Group, Inc.
| Reading Hospital & Medical CenterThe Regence Group
| | Scripps Networks Interactive, Inc. | | Standard Motor Products, Inc. | Regency Centers Corporation | | Seaboard Corporation | | State of MinnesotaStanley Black & Decker, Inc.
| RealogyRegions Financial Corporation
| | Seacoast National Bank | | Staples, Inc. | Reinsurance Group of America | | Seacor Holdings, Inc. | | Starbucks Corporation | Reliance Steel & Aluminum Company | | Sealed Air Corporation | | State Personnel AdministrationStarwood Hotels & Resorts Worldwide
| Regal Entertainment GroupRemington Arms Company, Inc.
| | Sealy, Inc. | | State Street Corporation Commission | Regal-BeloitRenaissance Learning, Inc.
| | Seaman Corporation | | State of Oregon | Renown Health | | Sears Holdings Corporation | | State Personnel Administration | Rent-A-Center, Inc. | | Seco Tools, Inc. | | State Street Corporation | Republic Services, Inc. | | Select Medical Holdings Corporation | | Stater Bros. Holdings, Inc. | The Regence GroupRes-Care, Inc.
| | Seco Tools,Selective Insurance Group, Inc.
| | Steel Dynamics, Inc. | Regency Centers Corporation
| | Securitas Security Services USA
| | Steelcase,Rexel, Inc.
| Regions Financial Corporation
| | Securus Technologies, Inc.
| | Stepan Company
| Reliance Steel & Aluminum
| | Self Regional Healthcare
| | Stericycle, Inc.
| Reliant Energy
| | SEMCO Energy | | Sterilite CorporationSteel Technologies-Corporate
| Remington Arms Company,Reynolds American, Inc.
| | SemGroup Corporation | | Steelcase, Inc. | Rice University | | Sempra Energy | | STERISStepan Company
| Remy International, Inc.
| | Senco Products, Inc.
| | Sterling Bank
| Renaissance Learning,RiceTec, Inc.
| | Sentara Healthcare | | Stinger Ghaffarian TechnologiesSterilite Corporation
| Rent-A-Center, Inc.Rich Products Corporation
| | Sentry Group | | Stonyfield Farm, Inc.STERIS
| Republic Services,Richco
| | Sentry Insurance | | Sterling Bank | Ricoh Electronics, Inc. | | Serco, Inc. | | Storck USA LPStewart & Stevenson
| Rewards NetworkRite – Hite Holding Corporation
| | Service Corporation International | | Structural Associates, Inc.Stewart Information Services
| Rexel, Inc.Robert Bosch LLC
| | The ServiceMaster Company | | Stryker CorporationStonyfield Farm, Inc.
| Reynolds American, Inc.Robert Bosch Tool Corporation
| | Seventh Generation | | Stryker Corporation | Robert Half International, Inc. | | SFN Group, Inc. | | Subuaru of Indiana Automotive, Inc. | RiceTec, Inc.Roche Diagnostics
| | Shands HealthCare | | Sulzer Pumps US, Inc. | Rich Products CorporationRock-Tenn Company
| | Sharp Electronics Corporation | | Sun Healthcare Group, Inc. | RichcoRockwell Automation
| | The Shaw Group, Inc.
| | Sundt CompaniesSun Microsystems, Inc.
| Ricoh Electronics,Rockwell Collins, Inc.
| | Sherwin-Williams Company | | SunGard Data Systems, Inc.Suncoast Schools Federal Credit Union
| Rite-Hite CorporationRockwood Holdings, Inc.
| | Sigma Aldrich | | Sungard Data Systems, Inc. | Rollins, Inc. | | Sigma-Aldrich Corporation | | Sunoco, Inc. | Rite Aid CorporationRoper Industries
| | Silgan Holdings, Inc. | | Sunrise Senior Living, Inc. | Robert Half International,Roper Industries, Inc.
| | Simmons Bedding Company | | Sunstar Americas | Ross Stores, Inc. | | Simon Property Group, Inc. | | SunTrustSuntrust Banks, Inc.
| Roche Diagnostics
| | Simpson Housing LLLP
| | Superior Energy Services,Rowan Companies, Inc.
| Rock-Tenn Company
| | Sirius Computer Solutions, Ltd.XM Radio, Inc. | | SUPERVALU,Supermedia, Inc.
| Rockwell AutomationRoyal Bank of Canada
| | Sitel | | SuperValue | Royal Caribbean Cruise Line | | SJE-Rhombus | | SureWest Communications Company
| Rockwell Collins, Inc.
| | SkyWest, Inc.
| | Susser Holdings Corporation | Rockwood Holdings,RR Donnelley & Sons Company
| | Skywest, Inc. | | Sutter Health | RRI Energy | | SLM Corporation | | Swiss Reinsurance | RSC Equipment Rental | | Smead Manufacturing Company | | Sykes Enterprises | Rollins, Inc.
| | Smith International, Inc.
| | SYNNEX Corporation
| Roper IndustriesRSM McGladrey
| | SMSC Gaming Enterprise | | SynovateSymetra Financial Corporation
| Roper Industries, Inc.Ruddick Corporation
| | Smurfit-Stone Container Corporation | | SYNNEX Corporation | Ryder System, Inc. | | Snap-On, Inc. | | Synovate | The Ryland Group | | Snyder’s of Hanover | | Synovus Financial Corporation | Ross Stores, Inc.S&C Electric Company
| | Snap-on IncorporatedSolae LLC
| | Synthes | Roundy’s,Safety-Kleen Systems, Inc.
| | Sole Technology, Inc. | | SYSCO Corporation | Safeway, Inc. | | Solo Cup Company | | SYSCO CorporationSystemax, Inc.
| Rowan Companies, Inc.Safilo USA
| | Solutia, Inc. | | Systemax, Inc.
| RR Donnelley & Sons Company
| | Somerset Medical Center
| | T. Rowe Price Group Inc. | RSC Holdings, Inc.SAGE Publications
| | Sonic Automotive, Inc. | | Targa Resources Inc. | Ruddick Corporation
| | Sonoco Products Company
| | Target Corporation
| Rutgers University
| | South Jersey Gas Company
| | Tastefully Simple
| Ryder System, Inc.
| | Southeastern Freight Lines
| | The Taubman Company
| The Ryland Group, Inc.
| | The Southern Company
| | Taylor Corporation
| S&C Electric Company
| | Southern Farm Bureau Life Insurance
| | TD Ameritrade Holding Corporation
| SAC Federal Credit Union
| | Southern Poverty Law Center
| | TDS Telecom CorporationPartners LP
|
| | | | A-12 | MDU Resources Group, Inc.Proxy Statement |
| | | | | Target Corporation | | Unilife Corporation | | Virgin Media, Inc. | Tastefully Simple | | Union Pacific Corporation | | Visa, Inc. | The Taubman Company | | Unisys Corporation | | Vishay Intertechnology, Inc. | Taylor Corporation | | United HealthCare Group | | Visiting Nurse Association of the Inland | TD Ameritrade Holding Corporation | | United Natural Foods, Inc. | | Counties | TDS Telecom Corporation | | United Parcel Service, Inc. | | Visiting Nurse Service of New York | Team Health Holdings, Inc. | | United Refining Company | | Visteon Corporation | Tech Data Corporation | | Universal Health Services,United Rentals, Inc.
| | Wake County GovernmentVolvo Group North America
| TECO Energy, Inc. | | United States Steel Corporation | | Vornado Realty Trust | Tecolote Research, Inc. | | United Stationers, Inc. | | Vought Aircraft Industries, Inc. | TelAlaska, Inc. | | United Technologies Corporation | | Vulcan Materials Company | Tele-Consultants, Inc. | | United Way for Southeastern Michigan | | W C Bradley Company | Teledyne Technologies, Inc. | | Unitrin, Inc. | | W R Grace & Company | Teleflex | | Universal American Corporation | | W.R. Berkley Corporation | Telephone & Data Systems, Inc. | | Universal Forest Prods, Inc. | | W.W. Grainger, Inc. | Tellabs Operations, Inc. | | Universal Health Services | | Wackenhut Services, Inc. | Temple-Inland, Inc. | | Universal Orlando | | Waldrop, Inc.Wake County Government
| Tecolote Research,Tenaris, Inc.
| | University Health System
| | Walgreen Company
| Tele-Consultants, Inc.
| | University of Akron
| | Wal-Mart Stores, Inc.
| Teledyne Technologies Incorporated
| | University of Alabama at Birmingham | | The Walt DisneyWalgreen Company
| TeleflexTenet Healthcare Corporation
| | University of California at BerkeleyArkansas for Medical Science | | Wal-Mart Stores, Inc. | Tenneco, Inc. | | The Warnaco Group, Inc. | Telephone & Data Systems, Inc.
| | University of Chicago | | Warner Music Group CorporationWalt Disney Company
| TeletechTeradata Corporation
| | University of Georgia | | The Washington Post CompanyWalter Energy
| Tellabs,Terex Corporation
| | University of Houston | | Warnaco Group, Inc. | Terra Industries, Inc. | | University of Kansas Hospital | | Washington University in St. LouisWarner Music Group Corporation
| Temple-Inland, Inc.Tescom Corporation
| | University of Louisville | | Waste Management, Inc.Washington Post
| Tenet HealthcareTesoro Corporation
| | University of Maryland Medical Center | | Washington Suburban Sanitary Commission | Tetra Tech, Inc. | | University of Miami | | Washington University in St. Louis | Texas County & District Retirement System | | University of Michigan | | Watson Pharmaceuticals,Waste Industries, Inc.
| Tenneco,Texas Industries, Inc.
| | University of Minnesota | | Wayne Memorial HospitalWaste Management, Inc.
| Teradata CorporationTexas Instruments, Inc.
| | University of Nebraska-Lincoln | | Weir Slurry GroupWatsco, Inc.
| Terex CorporationTexas Mutual Insurance Company
| | University of Notre Dame | | Weis Markets,Watson Pharmaceuticals, Inc.
| Tesoro CorporationTextron, Inc.
| | University of Pennsylvania | | Wawa, Inc. | Thermo Fisher Scientific, Inc. | | University of Rochester | | Wayne Memorial Hospital | Thomas & Betts Corporation | | University of South Florida | | Wellcare Health Plans | Texas County & District Retirement SystemTI Group Automotive Systems LLC
| | University of St. Thomas | | Wellmark BlueCross BlueShield | Texas Industries, Inc.Tiffany & Co.
| | University of Texas at Austin | | WellPoint,Wellpoint, Inc.
| Texas Instruments IncorporatedThe Timberland Company
| | University of Texas Southwestern Medical | | Wells Fargo & Company
| Textron, Inc.
| | Health Science Center | | Wells’ Dairy, Inc.
| Thermo Fisher Scientific, Inc.
| | University of Virginia
| | Wendy’s/Arby’s Group, Inc. | Thomas & Betts CorporationTime Warner Cable
| | The University of Texas M.D. Anderson | | Werner Company | Time Warner, Inc. | | Cancer Center | | Werner Enterprises, Inc. | TIMET | | University of Texas Southwestern | | WESCO International, Inc. | Timken Company | | Medical Center | | West Penn Allegheny Health System | TJX Companies, Inc. | | University of Wisconsin Medical Foundation | | Werner CompanyWest Pharmaceutical Services
| Thomas Jefferson University HospitalToll Brothers, Inc.
| | University Physicians, Inc. | | Werner Enterprises,West Virginia University Hospitals, Inc.
| Thomson, Inc.
| | Univision Communications, Inc.
| | WESCO International, Inc.
| Thor Industries, Inc.Torchmark Corporation
| | Unum Group | | West Bend Mutual Insurance CompanyWestar Energy, Inc.
| Tiffany &The Toro Company
| | UPS | | West Penn Allegheny Health SystemWestern Refining, Inc.
| Time Warner CableToys R Us, Inc.
| | Urban Outfitters, Inc. | | West Virginia University HospitalsWestern Southern Financial Group
| Time Warner, Inc.Tractor Supply Company
| | URS Corporation | | Westar Energy, Inc.Western Textile Companies
| TIMETTravelcenters of America LLC
| | US Airways Group, Inc. | | Western Refining, Inc.Union Company | The Timken CompanyTravelers Companies, Inc.
| | US Bancorp | | Westfield Group | Travis County | | US Foodservices | | Western Southern Financial GroupWestlake Chemical Corporation
| TJX Companies,Treasure Island Resort & Casino
| | US Oncology Holdings, Inc. | | US Steel Corporation
| | Western Textile CompaniesWeston Solutions, Inc.
| Toll Brothers,Tremco, Inc.
| | USAA | | Western UnionWeyerhaeuser Company
| Torchmark CorporationTribune Company
| | USEC, Inc. | | WGL Holdings, Inc. | Tri-Met | | USG Corporation | | Westlake Chemical CorporationWheaton Franciscan Healthcare
| The Toro Company
| | Utah Retirement Systems
| | Weston Solutions, Inc.
| Total Mechanical, Inc.Trinity Health
| | Utah Transit Authority | | Weyerhaeuser CompanyWheels, Inc.
| Toys “R” Us, Inc.Trinity Industries
| | Utica National Insurance | | WGL Holdings, Inc.Whirlpool Corporation
| Tractor Supply Company
| | V S ETriple-S Management Corporation
| | Wheaton Franciscan Healthcare
| TransUnion
| | Vail Resorts Inc.Management Company | | Whirlpool CorporationWhole Foods Market, Inc.
| Travel Guard – AIGTriwest Healthcare Alliance
| | Valassis Communications, Inc. | | Whole Foods Market, Inc.Wilbur Smith Associates
| TravelCenters of America LLCTruckPro, Inc.
| | Valero Energy Corporation | | The Wilder Foundation | The Travelers Companies,True Value Company
| | Valhi, Inc. | | VALHI,Williams Companies, Inc.
| | William Rainey Harper College
| Travis CountyTRW Automotive Holdings Corporation
| | Valmont Industries, Inc. | | Williams Companies,Williams-Sonoma, Inc.
| Treasure Island Resort & CasinoTSYS
| | Van Andel Institute | | Williams-SonomaWilmer Hale
| Tredegar Industries, Inc.Tufts Health Plan
| | Vangent, Inc. | | Wilmer HaleWilsonart International
| Tribune CompanyTupperware Corporation
| | Varian Medical Systems, Inc. | | Windstream Communications | Tri-MetTurner Broadcasting System, Inc.
| | Vectren Corporation | | Winn-Dixie Stores, Inc. | Trinity Consultants, Inc.Tutor Perini Corporation
| | Venetian Resort-Hotel-Casino | | Winpak Portion Packaging, Ltd. | Trinity Industries, Inc.Tyco Electronics
| | Ventura Foods LLC | | Wisconsin Energy Corporation | Triwest Healthcare AllianceTyson Foods, Inc.
| | Venturedyne, Ltd. | | WMSWisconsin Physicians Service
| True Value CompanyUAL Corporation
| | Verde Realty | | World Fuel ServicesInsurance Corporation
| TRW Automotive Holdings CorporationUDR
| | Verizon Communications, Inc. | | Wolverine World Vision InternationalWide, Inc. | TSYS
| | Verso PaperUGI Corporation
| | World Vision United States
| Tufts Health PlanVermeer Manufacturing Company
| | Vesuvius USA
| | Worley ParsonsWorld Fuel Services Corporation
| Tupperware CorporationUMB Bank NA
| | VF Corporation | | The Wornick CompanyWorld Vision International
| Turner Broadcasting System, Inc.UMDNJ-University of Medicine & Dentistry
| | Via Christi Regional Medical Center | | Worthington Industries | Tyco ElectronicsUnderwriters Laboratories, Inc.
| | Viacom, Inc. | | Wyle Laboratories | Tyson Foods,Unified Grocers, Inc.
| | Viad Corporation
| | Wyndham Worldwide Corporation
| U.S. Bancorp
| | Viant Health Payment Solutions | | Wynn Resorts, LimitedWyndham Worldwide Corporation
| UAL Corporation
| | Viasystems Group, Inc.
| | Xcel Energy, Inc.
| UGI CorporationUnified Personnel System
| | Viejas Enterprise | | Xerox Corporation
| UMB Bank NA
| | Virgin Media, Inc.
| | XTO Energy, Inc.
| UMDNJ-University of Medicine & Dentistry
| | Visa, Inc.
| | Yahoo!, Inc.
| Underwriters Laboratories, Inc.
| | Vishay Intertechnology
| | Yale University
| Unified Grocers, Inc.
| | Visteon Corporation
| | Yamaha Motor Corporation USA
| Union Pacific Corporation
| | Volt Information Sciences, Inc.
| | Yankee Candle Company
| Unisys Corporation
| | Volvo Group North America
| | YKK Corporation of America
| United HealthCare Group
| | Vornado Realty Trust
| | YRC Worldwide, Inc.
| United Natural Foods, Inc.
| | Vought Aircraft Industries, Inc.
| | YSI
| United Refining Company
| | Vulcan Materials Company
| | Yum! Brands, Inc.
| United Rentals, Inc.
| | VWR International
| | Zale Corporation
| United Stationers, Inc.
| | W C Bradley Company
| | Zappos.com
| United Technologies Corporation
| | W R Grace & Company
| | Zebra Technologies Corporation
| UnitedHealth Group, Inc.
| | W W Grainger, Inc.
| | Zimmer Holdings, Inc.
| Unitrin, Inc.
| | W.R. Berkley Corporation
| | Zions Bancorporation
| Universal American Corporation
| | WABCO Holdings, Inc.
| | Zurich North America
| Universal Forest Products, Inc.
| | Wackenhut Services, Inc.
| | Wynn Resorts, Ltd. |
| | | | MDU Resources Group, Inc.Proxy Statement | A-13 |
| Xcel Energy, Inc. | Xerox Corporation | Yahoo, Inc. | Yamaha Corporation of America | Yankee Candle Company | YKK Corporation of America | YSI | Yum Brands, Inc. | Zale Corporation | Zeon Chemicals LP | Zimmer, Inc. | Zions Bancorporation |
(This page has been left blank intentionally.)
| | | | A-14 | MDU Resources Group, Inc.Proxy Statement |
| EXHIBITEXHIBIT B
| | Companies Surveyed using Equilar, Inc. – | MDU Resources Group, Inc. – President & Chief Executive Officer | Competitive Analysis Measuring Long-Term Incentiveto Determine Base Salary, Target Annual Cash Compensation,
and Target Total Direct Compensation |
Compensation and Supplemental Income Security Plan Benefits
| | | | | AGL Resources Inc. | Allegheny
Alliant Energy Inc.
| Amer. Water Works Co., Inc.
| Armstrong World Ind., Inc.
| Corp.
Ameren Corp.
ARC Resources Ltd.
Atmos Energy Corp. | BJ Services
Avista Corp.
Berry Petroleum Co.
| Bucyrus International Inc.
| Cameron International
Black Hills Corp.
| Centex Corp.
|
Boardwalk Pipeline Partners, LP
Chicago Bridge & Iron Co.
|
Cimarex Energy Co.
CMS Energy Corp.
| CVR Energy
Comfort Systems USA Inc.
| Delek US Holdings,
Compass Minerals International Inc.
|
Complete Production Services, Inc.
Comstock Resources Inc.
DCP Midstream Partners, LP
Denbury Resources Inc.
Diamond Offshore Drilling, Inc.
| Dynegy
DPL Inc.
|
El Paso Corp.
|
EMCOR Group, Inc.
Energen Corp.
Energy Transfer Equity, L.P.
|
Enerplus Corp.
Ensco plc
EOG Resources, Inc.
| FMC Technologies
EQT Corp.
Foster Wheeler AG
Granite Construction Inc.
| Global
Helix Energy Solutions Group, Inc.
Helmerich & Payne, Inc.
Integrys Energy Group, Inc.
Key Energy Services Inc.
Laclede Group, Inc.
Layne Christenson Co.
MarkWest Energy Partners, LP
| Hawaiian Electric Ind.,L.P.
Martin Marietta Materials, Inc.
| Holly Corp.
| Lennar Corp.
| McDermott International
MasTec, Inc.
| Mirant Corp.
|
Nabors Industries Ltd.
|
National Fuel Gas Co.
New Jersey Resources Corp.
|
Newfield Exploration Co.
Nexen Inc.
|
Nicor Inc.
|
NiSource Inc.
Noble Corp.
|
Noble Energy Inc.
| Northeast Utilities
| Nustar Energy L.P.
|
Northwest Natural Gas Co.
NorthWestern Corp.
NV Energy Inc.
| NVR
Oceaneering International Inc.
| Oil States
Patterson UTI Energy Inc.
Pengrowth Energy Corp.
Penn West Petroleum Ltd.
Pepco Holdings, Inc.
Petrohawk Energy Corp.
Piedmont Natural Gas Co. Inc.
Pike Electric Corp.
Pioneer Natural Resources Co.
Plains Exploration & Production Co.
Precision Drilling Corp.
Pride International Inc.
| Owens Corning
| Patriot CoalQEP Resources, Inc.
Quanta Services, Inc.
Questar Corp.
| Pinnacle West Capital
Range Resources Corp.
| Puget
Regency Energy Partners LP
Rowan Companies Inc.
| Pulte Homes
RPC Inc.
| RPM International Inc.
|
SCANA Corp.
SM Energy Co.
Southern Union Co.
|
Southwest Gas Corp.
Southwestern Energy Co.
|
Spectra Energy Corp.
| Sunoco Logistics
Sterling Construction Co. Inc.
Superior Energy Services Inc.
Swift Energy Co.
Talisman Energy Inc.
Targa Resources Partners L.P.
| TecoLP
Texas Industries Inc.
TransCanada Corp.
UGI Corp.
USEC Inc.
Vectren Corp.
Vulcan Materials Co.
Westar Energy Inc.
| Transalta Corp.
| Tutor Perini Corp.
| UGI Corp.
| USG Corp.
| Valspar Corp.
| Watsco Inc.
|
WGL Holdings, Inc.
Whiting Petroleum Corp.
Willbros Group, Inc.
Wisconsin Energy Corp.
Companies Surveyed using
Equilar, Inc.
MDU Resources Group, Inc. –
Vice President & Chief
Financial Officer
Competitive Analysis to
Determine Base Salary,
Target Annual Cash
Compensation, and Target Total
Direct Compensation
Alliant Energy Corp.
Ameren Corp.
ARC Resources Ltd.
Atmos Energy Corp.
Avista Corp.
Berry Petroleum Co.
BJ Services Co.
Black Hills Corp.
Chicago Bridge & Iron Co.
Cimarex Energy Co.
CMS Energy Corp.
Comfort Systems USA Inc.
Compass Minerals International Inc.
Complete Production Services, Inc.
Comstock Resources Inc.
Denbury Resources Inc.
Diamond Offshore Drilling, Inc.
DPL Inc.
| | EMCOR Group, Inc.
Enerplus Corp.
Ensco plc
EOG Resources, Inc.
EQT Corp.
Foster Wheeler AG
Granite Construction Inc.
Helix Energy Solutions Group, Inc.
Helmerich & Payne, Inc.
Integrys Energy Group, Inc.
Key Energy Services Inc.
Layne Christenson Co.
MarkWest Energy Partners, L.P.
Martin Marietta Materials, Inc.
MasTec, Inc.
Nabors Industries Ltd.
National Fuel Gas Co.
Newfield Exploration Co.
Nexen Inc.
NiSource Inc.
Noble Corp.
Noble Energy Inc.
Northwest Natural Gas Co.
NorthWestern Corp.
NV Energy Inc.
Oceaneering International Inc.
Patterson UTI Energy Inc.
Pengrowth Energy Corp.
Penn West Petroleum Ltd.
Pepco Holdings, Inc.
Petrohawk Energy Corp.
Pike Electric Corp.
Pioneer Natural Resources Co.
Plains Exploration & Production Co.
Precision Drilling Corp
Pride International Inc.
QEP Resources, Inc.
Quanta Services, Inc.
Questar Corp.
Range Resources Corp.
Regency Energy Partners LP
Rowan Companies Inc.
RPC Inc.
SCANA Corp.
SM Energy Co.
Southern Union Co.
Southwest Gas Corp.
Southwestern Energy Co.
Sterling Construction Co. Inc.
Superior Energy Services Inc.
Swift Energy Co.
Talisman Energy Inc.
Texas Industries Inc.
UGI Corp.
USEC Inc.
Vectren Corp.
Vulcan Materials Co.
Westar Energy Inc.
Whiting Petroleum Corp.
Willbros Group, Inc.
Wisconsin Energy Corp. |
| | | | MDU Resources Group, Inc.Proxy Statement | B-1 |
(This page has been left blank intentionally.)
| | | | B-2
| MDU Resources Group, Inc.Proxy Statement
|
EXHIBIT C
| Companies Surveyed using Equilar, Inc. –
| Fidelity Exploration & Production Company – Chief Executive Officer
| Competitive Analysis Measuring Base Salary, Target Annual Cash
| Compensation, and Target Total Direct Compensation
| | ATP Oil & Gas Corp
| Atwood Oceanics Inc
| Berry Petroleum Co
| Bill Barrett Corp
| Clayton Williams Energy Inc
| CNX Gas Corp
| Comstock Resources Inc
| Concho Resources Inc
| Continental Resources Inc
| Eagle Rock Energy Partners L P
| Encore Acquisition Co
| Energy XXI (Bermuda) Ltd
| Exco Resources Inc
| Forest Oil Corp
| Geokinetics Inc
| Global Geophysical Services Inc
| Gran Tierra Energy, Inc.
| Hercules Offshore, Inc.
| Ion Geophysical Corp
| Linn Energy, LLC
| Markwest Energy Partners L P
| McMoran Exploration Co
| Parker Drilling Co
| Patterson Uti Energy Inc
| Penn Virginia Corp
| Pioneer Drilling Co
| Quicksilver Resources Inc
| Rosetta Resources Inc
| Sandridge Energy Inc
| St Mary Land & Exploration Co
| Stone Energy Corp
| Swift Energy Co
| Ultra Petroleum Corp
| Unit Corp
Venoco, Inc.
| W&T Offshore Inc.
|
| | | | MDU Resources Group, Inc.Proxy Statement
| C-1
|
| (This page has been left blank intentionally.)Companies Surveyed using Equilar, Inc.
| Exploration and Production Segment – President & Chief Executive Officer | Competitive Analysis to Determine Base Salary, Target Annual Cash Compensation,
and Target Total Direct Compensation | | Advantage Oil & Gas Ltd. | ATP Oil & Gas Corp. | Atwood Oceanics Inc. | Berry Petroleum Co. | Bill Barrett | BreitBurn Energy Partners L.P. | Cabot Oil & Gas Corp. | Cheniere Energy, Inc. | Clayton Williams Energy, Inc. | Comstock Resources Inc | Continental Resources Inc. | Eagle Rock Energy Partners L.P. | Energy XXI (Bermuda) Ltd. | EQT Corp. | EXCO Resources Inc. | Geokinetics Inc. | Global Geophysical Services Inc. | Gran Tierra Energy Inc. | Hercules Offshore, Inc. | Ion Geophysical | Linn Energy, LLC | Parker Drilling Co. | Penn Virginia Corp. | Petroleum Development Corp. | Pioneer Drilling Co. | Rosetta Resources Inc. | SM Energy Co. | Stone Energy Corp. | Swift Energy Co. | Vantage Drilling Co. | Venoco, Inc. | W&T Offshore Inc. | Whiting Petroleum Corp. | | Companies Surveyed using Equilar, Inc. | Pipeline and Energy Services Segment – President & Chief Executive Officer | Competitive Analysis to Determine Base Salary, Target Annual Cash Compensation, | and Target Total Direct Compensation | | Atlas Pipeline Partners, L.P. | Basic Energy Services, Inc. | Cal Dive International, Inc. | Chesapeake Utilities Corporation | Copano Energy, L.L.C. | Core Laboratories Inc. | Delta Natural Gas Company, Inc. | Dune Energy, Inc. | Global Industries, Ltd. | National Fuel Gas Co. | Natural Gas Services Group, Inc. | Northwest Natural Gas Co. | Questar Corp. | RGC Resources, Inc. | South Jersey Industries, Inc. | Southern Union Co. | Western Gas Partners, LP |
| | | | C-2B-2
| MDU Resources Group, Inc.Proxy Statement |
(This page has been left blank intentionally.)
(This page has been left blank intentionally.)
MDU RESOURCES GROUP, INC. ANNUAL MEETING OF STOCKHOLDERS Tuesday, April 24, 2012 23, 2013
11:00 a.m. Central Daylight Saving Time
909 Airport Road
Bismarck, ND

| | |  | | | | | | 1200 West Century Avenue | proxy | | | | Mailing Address: | |
P.O. Box 5650 | | Bismarck, ND 58506-5650 | |
(701) 530-1000 | | | proxy |
This proxy is solicited on behalf of the Board of Directors for the
Annual Meeting of Stockholders on April 24, 2012.23, 2013. This proxy will also be used to provide voting instructions to New York Life Trust Company, as Trustee of the MDU Resources Group, Inc. 401(k) Retirement Plan, for any shares of Company common stock held in the plan. The undersigned hereby appoints Harry J. Pearce and Paul K. Sandness and each of them, proxies, with full power of substitution, to vote all Common Stock of the undersigned at the Annual Meeting of Stockholders to be held at 11:00 a.m., Central Daylight Saving Time, April 24, 2012,23, 2013, at 909 Airport Road, Bismarck, ND, and at any adjournment(s) thereof, upon all subjects that may properly come before the meeting, including the matters described in the Proxy Statement furnished herewith, subject to any directions indicated on the reverse side.Your vote is important! Ensure that your shares are represented at the meeting.Either (1) submit your proxy by touch-tone telephone, (2) submit your proxy by Internet, or (3) mark, date, sign, and return this proxy card in the envelope provided (no postage is necessary if mailed in the United States).If no directions are given, the proxies will vote in accordance with the Directors’ recommendation on all matters listed on this proxy, and at their discretion on any other matters that may properly come before the meeting. See reverse for voting instructions.
| Shareowner Services
P.O. Box 64945
St. Paul, MN 55164-0945 | |
| | | | | | | Shareowner Services | | | | | P.O. Box 64945 | | | | | St. Paul, MN 55164-0945 | | | | COMPANY # | | |
| | Vote by Internet, Telephone or Mail
24 Hours a Day, 7 Days a Week | | | | | | | | | | | | | | | | Vote by Internet, Telephone or Mail
24 Hours a Day, 7 Days a Week | | | | | | | | | | | Your telephone or Internet vote authorizes the named
proxies to vote your shares in the same manner as if
you
marked, signed, and returned your proxy card. | | | | | | | | | | : | |  | INTERNET – www.eproxy.com/mdu | | | |
Use the Internet to vote your proxy until 12:00 p.m.
(CDT) on Monday, April 23, 2012.22, 2013. | | | | | | | | | | ( | |  | TELEPHONE – 1-800-560-1965 | | | |
Use a touch-tone telephone to vote your proxy until
12:00 p.m. (CDT) on Monday, April 23, 2012.22, 2013. | | | | | | | | | | * | |  | MAIL – Mark, sign, and date your proxy card and return it in the postage-paid envelope provided, or return it to
MDU Resources Group, Inc., c/o Shareowner Services,
P.O. Box 64873, St. Paul, MN 55164-0873. | | | | |
If you vote by Telephone or Internet, please do not mail your Proxy Card. 
 Please detach here Please detach here
The Board of Directors Recommends a Vote “FOR” all nominees and “FOR” Items 2 and 3. | | | | | | | | | | | | | 1. | Election of directors: | | Election of Directors: | | | | | | | | FOR | AGAINST | ABSTAIN | | FOR | AGAINST | ABSTAIN | | | FOR | AGAINST | ABSTAIN | | | FOR | AGAINST | ABSTAIN | | | | | | | | | | 01. | Thomas Everist | ☐ | | 06. | Thomas C. Knudson | ☐ | | Thomas Everist | o | o | | 06. | Thomas C. Knudson | o | o | | | | | | | | | | 02. | Karen B. Fagg | ☐ | | 07. | Richard H. Lewis | ☐ | | Karen B. Fagg | o | o | | 07. | Patricia L. Moss | o | o | | | | | | | | | | 03. | Terry D. Hildestad | ☐ | | 08. | Patricia L. Moss | ☐ | | David L. Goodin | o | o | | 08. | Harry J. Pearce | o | o | | | | | | | | | | 04. | A. Bart Holaday | ☐ | | 09. | Harry J. Pearce | ☐ | | A. Bart Holaday | o | o | | 09. | J. Kent Wells | o | | | | | | | | | | 05. | Dennis W. Johnson | ☐ | | 10. | John K. Wilson | ☐ | | Dennis W. Johnson | o | o | | 10. | John K. Wilson | o | o |
| 2. | Ratification of Deloitte & Touche LLP as the company’s independent auditors for 2012.2013. | | | ☐o | For | ☐o | Against | ☐o | Abstain | | | | | | | | | | | | | | | 3. | Advisory vote to approveApproval, on a non-binding advisory basis, of the compensation of the company’s named executive officers. | | | ☐o | For | ☐o | Against | ☐o | Abstain | |
THIS PROXY WHEN PROPERLY EXECUTED WILL BE VOTED AS DIRECTED OR, IF NO DIRECTION IS GIVEN, WILL BE VOTEDFOR ALL NOMINEES ANDFOR ITEMS 2 AND 3. Address Change? Mark box, sign, and indicate changes below:☐o | Date | |
| | | | |
| | Signature(s) in Box | | Please sign exactly as your name(s) appears on Proxy. If held in joint tenancy, all persons should sign. Trustees, administrators, etc., should include title and authority. Corporations should provide full name of corporation and title of authorized officer signing the Proxy. |
|
|
|
|